

8.12 Air Leaks in the Duct
325
Assuming turbulent conditions, then γ = 0.5:
θ =
Q
L
0.5
i
Analysing the units in the expression:
θ
m
3
s
m · mmwc 0.5
Bearing in mind that 1 mmwc = 9.81 Pa, then:
Therefore, if you divide the constant θ by (9.81)
0.5 you can convert it to SI units
(θ SI ).
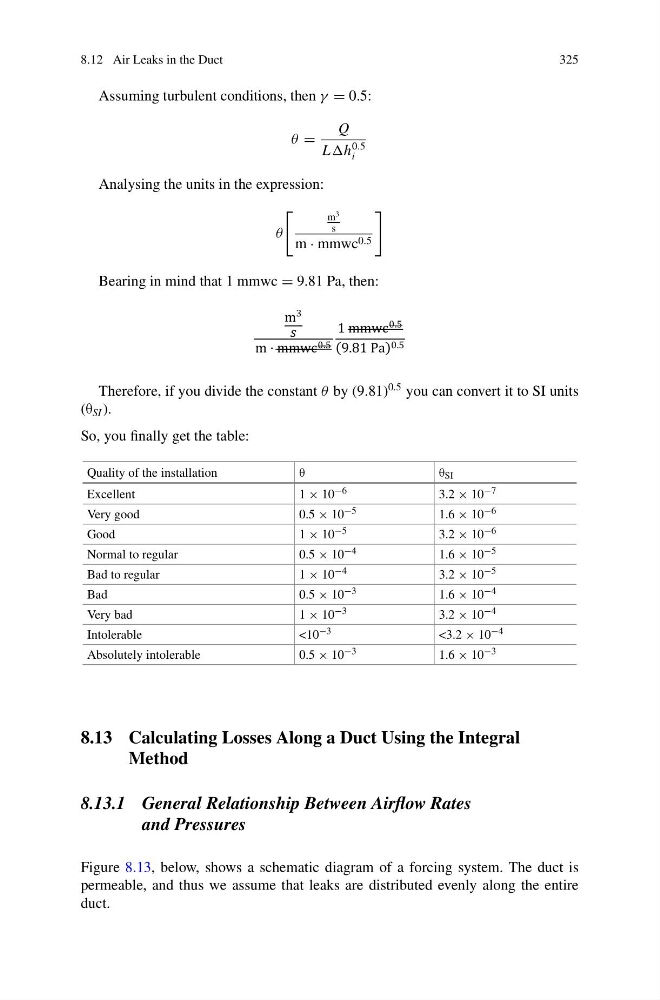
So, you finally get the table:
Quality of the installation
θ
θ SI
Excellent
1 × 10 −6
3.2 × 10 −7
Very good
0.5 × 10 −5
1.6 × 10 −6
Good
1 × 10 −5
3.2 × 10 −6
Normal to regular
0.5 × 10 −4
1.6 × 10 −5
Bad to regular
1 × 10 −4
3.2 × 10 −5
Bad
0.5 × 10 −3
1.6 × 10 −4
Very bad
1 × 10 −3
3.2 × 10 −4
Intolerable
<10 −3
<3.2 × 10 −4
Absolutely intolerable
0.5 × 10 −3
1.6 × 10 −3
8.13 Calculating Losses Along a Duct Using the Integral
Method
8.13.1 General Relationship Between Airflow Rates
and Pressures
Figure 8.13, below, shows a schematic diagram of a forcing system. The duct is
permeable, and thus we assume that leaks are distributed evenly along the entire
duct.
325
Assuming turbulent conditions, then γ = 0.5:
θ =
Q
L
0.5
i
Analysing the units in the expression:
θ
m
3
s
m · mmwc 0.5
Bearing in mind that 1 mmwc = 9.81 Pa, then:
Therefore, if you divide the constant θ by (9.81)
0.5 you can convert it to SI units
(θ SI ).
So, you finally get the table:
Quality of the installation
θ
θ SI
Excellent
1 × 10 −6
3.2 × 10 −7
Very good
0.5 × 10 −5
1.6 × 10 −6
Good
1 × 10 −5
3.2 × 10 −6
Normal to regular
0.5 × 10 −4
1.6 × 10 −5
Bad to regular
1 × 10 −4
3.2 × 10 −5
Bad
0.5 × 10 −3
1.6 × 10 −4
Very bad
1 × 10 −3
3.2 × 10 −4
Intolerable
<10 −3
<3.2 × 10 −4
Absolutely intolerable
0.5 × 10 −3
1.6 × 10 −3
8.13 Calculating Losses Along a Duct Using the Integral
Method
8.13.1 General Relationship Between Airflow Rates
and Pressures
Figure 8.13, below, shows a schematic diagram of a forcing system. The duct is
permeable, and thus we assume that leaks are distributed evenly along the entire
duct.