

4.3 Concept of Resistance of an Airway
99
The data can be linearized by taking logarithms of both R 100 and S, then:
log 10 A
log 10 R 100
1.30103
−0.55284
1.176091
−0.22915
1.113943
−0.02687
0.90309
0.462398
0.778151
0.778151
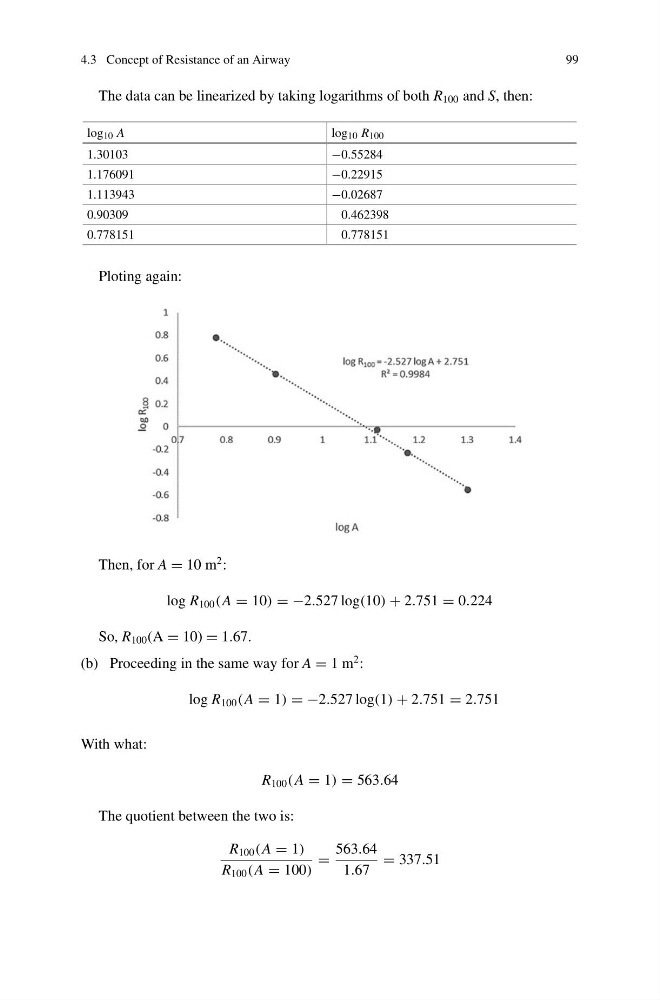
Ploting again:
Then, for A = 10 m
2 :
log R 100 (A = 10) = −2.527 log(10) + 2.751 = 0.224
So, R 100 (A = 10) = 1.67.
(b) Proceeding in the same way for A = 1 m
2 :
log R 100 (A = 1) = −2.527 log(1) + 2.751 = 2.751
With what:
R 100 (A = 1) = 563.64
The quotient between the two is:
R 100 (A = 1)
R 100 (A = 100)
=
563.64
1.67
= 337.51
99
The data can be linearized by taking logarithms of both R 100 and S, then:
log 10 A
log 10 R 100
1.30103
−0.55284
1.176091
−0.22915
1.113943
−0.02687
0.90309
0.462398
0.778151
0.778151
Ploting again:
Then, for A = 10 m
2 :
log R 100 (A = 10) = −2.527 log(10) + 2.751 = 0.224
So, R 100 (A = 10) = 1.67.
(b) Proceeding in the same way for A = 1 m
2 :
log R 100 (A = 1) = −2.527 log(1) + 2.751 = 2.751
With what:
R 100 (A = 1) = 563.64
The quotient between the two is:
R 100 (A = 1)
R 100 (A = 100)
=
563.64
1.67
= 337.51