

184
5 Performance Measurement
approximately evenly distributed over the rotational speed range from minimum
to maximum. Read at each operating point: rotational speed, torque, flow rate
(constant), head (constant).
5.6.4 Calculations
• Plot torque T (Nm) as a function of rotational speed n (rpm).
• Determine for each operating point: efficiency and speed ratio (see Chaps. 6 and
9 for definition of speed ratio). Plot efficiency as a function of speed ratio.
• Determine the speed ratio at maximum efficiency (interpolate, if necessary).
Compare to the theoretical value (Chap. 9). Explain the small difference.
5.6.5 Measurement Example
• Injector needle position: 8 revolutions open.
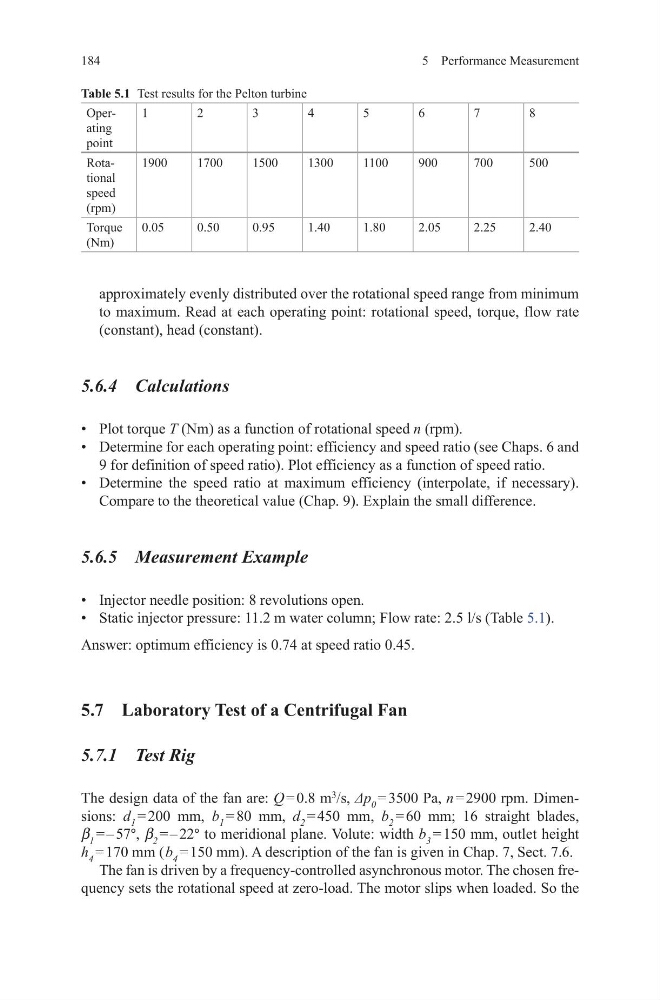
• Static injector pressure: 11.2 m water column; Flow rate: 2.5 l/s (Table 5.1).
Answer: optimum efficiency is 0.74 at speed ratio 0.45.
5.7 Laboratory Test of a Centrifugal Fan
5.7.1 Test Rig
The design data of the fan are: Q = 0.8 m
3
/s, Δp 0 = 3500 Pa, n = 2900 rpm. Dimensions: d 1 = 200 mm, b 1 = 80 mm, d 2 = 450 mm, b 2 = 60 mm; 16 straight blades,
β 1 = – 57°, β 2 = – 22° to meridional plane. Volute: width b 3 = 150 mm, outlet height
h 4 = 170 mm ( b 4 = 150 mm). A description of the fan is given in Chap. 7, Sect. 7.6.
The fan is driven by a frequency-controlled asynchronous motor. The chosen frequency sets the rotational speed at zero-load. The motor slips when loaded. So the
Table 5.1 Test results for the Pelton turbine
Operating
point
1
2
3
4
5
6
7
8
Rotational
speed
(rpm)
1900
1700
1500
1300
1100
900
700
500
Torque
(Nm)
0.05
0.50
0.95
1.40
1.80
2.05
2.25
2.40
5 Performance Measurement
approximately evenly distributed over the rotational speed range from minimum
to maximum. Read at each operating point: rotational speed, torque, flow rate
(constant), head (constant).
5.6.4 Calculations
• Plot torque T (Nm) as a function of rotational speed n (rpm).
• Determine for each operating point: efficiency and speed ratio (see Chaps. 6 and
9 for definition of speed ratio). Plot efficiency as a function of speed ratio.
• Determine the speed ratio at maximum efficiency (interpolate, if necessary).
Compare to the theoretical value (Chap. 9). Explain the small difference.
5.6.5 Measurement Example
• Injector needle position: 8 revolutions open.
• Static injector pressure: 11.2 m water column; Flow rate: 2.5 l/s (Table 5.1).
Answer: optimum efficiency is 0.74 at speed ratio 0.45.
5.7 Laboratory Test of a Centrifugal Fan
5.7.1 Test Rig
The design data of the fan are: Q = 0.8 m
3
/s, Δp 0 = 3500 Pa, n = 2900 rpm. Dimensions: d 1 = 200 mm, b 1 = 80 mm, d 2 = 450 mm, b 2 = 60 mm; 16 straight blades,
β 1 = – 57°, β 2 = – 22° to meridional plane. Volute: width b 3 = 150 mm, outlet height
h 4 = 170 mm ( b 4 = 150 mm). A description of the fan is given in Chap. 7, Sect. 7.6.
The fan is driven by a frequency-controlled asynchronous motor. The chosen frequency sets the rotational speed at zero-load. The motor slips when loaded. So the
Table 5.1 Test results for the Pelton turbine
Operating
point
1
2
3
4
5
6
7
8
Rotational
speed
(rpm)
1900
1700
1500
1300
1100
900
700
500
Torque
(Nm)
0.05
0.50
0.95
1.40
1.80
2.05
2.25
2.40