

76
2 Basic Components
where f is the Darcy friction factor. The Fanning friction factor is applied sometimes, defined by
2
1
w
2
/ (
v )
t
r
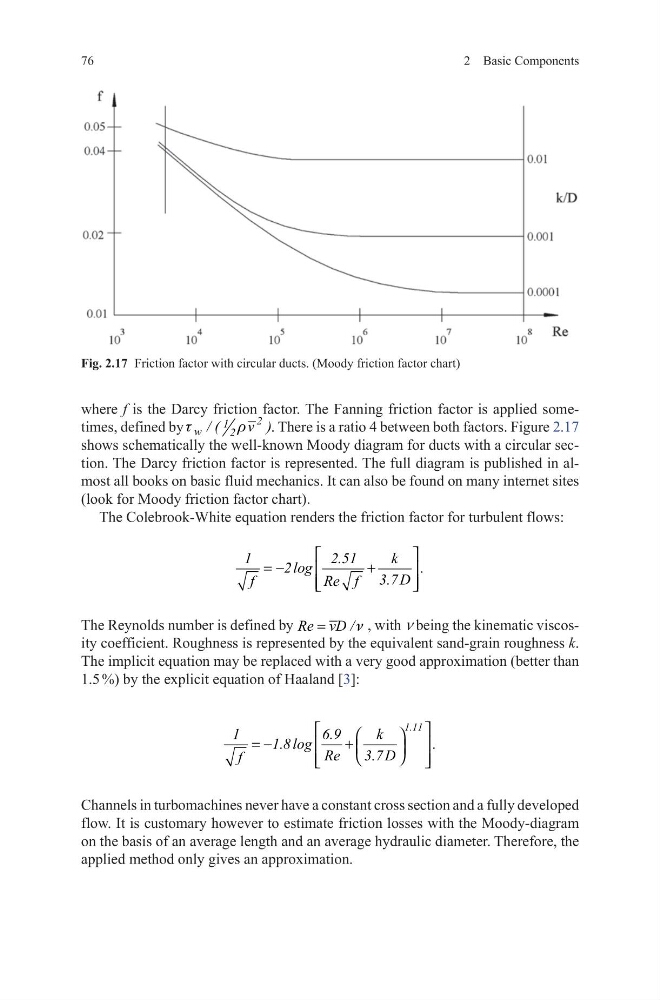
. There is a ratio 4 between both factors. Figure 2.17
shows schematically the well-known Moody diagram for ducts with a circular section. The Darcy friction factor is represented. The full diagram is published in almost all books on basic fluid mechanics. It can also be found on many internet sites
(look for Moody friction factor chart).
The Colebrook-White equation renders the friction factor for turbulent flows:
The Reynolds number is defined by Re vD / n
=
, with ν being the kinematic viscosity coefficient. Roughness is represented by the equivalent sand-grain roughness k.
The implicit equation may be replaced with a very good approximation (better than
1.5 %) by the explicit equation of Haaland [3]:
Channels in turbomachines never have a constant cross section and a fully developed
flow. It is customary however to estimate friction losses with the Moody-diagram
on the basis of an average length and an average hydraulic diameter. Therefore, the
applied method only gives an approximation.
1
2.51
k
2 log
.
3.7 D
f
Re f
= −
+
1.11
1
6.9
k
1.8 log
.
Re
3.7 D
f
= −
+
Fig. 2.17 Friction factor with circular ducts. (Moody friction factor chart)
2 Basic Components
where f is the Darcy friction factor. The Fanning friction factor is applied sometimes, defined by
2
1
w
2
/ (
v )
t
r
. There is a ratio 4 between both factors. Figure 2.17
shows schematically the well-known Moody diagram for ducts with a circular section. The Darcy friction factor is represented. The full diagram is published in almost all books on basic fluid mechanics. It can also be found on many internet sites
(look for Moody friction factor chart).
The Colebrook-White equation renders the friction factor for turbulent flows:
The Reynolds number is defined by Re vD / n
=
, with ν being the kinematic viscosity coefficient. Roughness is represented by the equivalent sand-grain roughness k.
The implicit equation may be replaced with a very good approximation (better than
1.5 %) by the explicit equation of Haaland [3]:
Channels in turbomachines never have a constant cross section and a fully developed
flow. It is customary however to estimate friction losses with the Moody-diagram
on the basis of an average length and an average hydraulic diameter. Therefore, the
applied method only gives an approximation.
1
2.51
k
2 log
.
3.7 D
f
Re f
= −
+
1.11
1
6.9
k
1.8 log
.
Re
3.7 D
f
= −
+
Fig. 2.17 Friction factor with circular ducts. (Moody friction factor chart)