

3 Biochar Applications in Agro-environmental
Development
The biochar can play multidisciplinary role in agricultural and environmental sustainability development due the longtime persistent nature in soil. The higher
concentration of stable organic matter with carbon contents was found of about
70–80% (Lehmann et al. 2002; Singh et al. 2017a) and mineral matter, including
nutrients, in higher quantity. Pyrolyzed biomass of agricultural waste has high
surface area, porosity, variable charge, and functional groups (Fig. 19.1) that can
increase soil water-holding capacity, pH, cation exchange capacity (CEC), base
saturation, bioremediation of hydrocarbons and heavy metals, and finally crop
resistance to disease when added to soil in adequate amount (Glaser et al. 2002;
Keech et al. 2005; Liang et al. 2006; Tang et al. 2013). These properties vary with
the pyrolysis temperature and types of feedstocks (Gundale and DeLuca 2006;
Bornermann et al. 2007; Chan and Xu 2009; Singh et al. 2010, 2017b). Biochar
application to soil is widely advocated for a variety of reasons related to sustainability (Jeffery et al. 2015). The most often claimed benefits of biochar include carbon
sequestration, soil fertility improvement, pollutant immobilization, pollutant remediation, and waste management. Furthermore, the additions of biochar to soil can
increase bacterial abundance that involve in bioremediation of soil pollutants and
reduce soil bulk density (Gundale and DeLuca 2006). Biochar strongly adsorbed
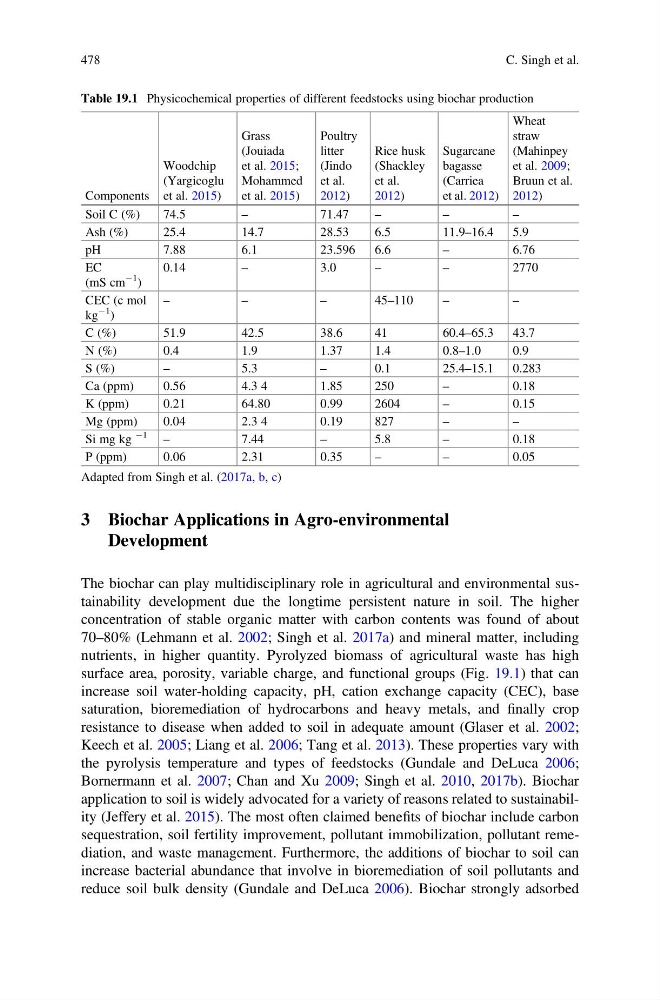
Table 19.1 Physicochemical properties of different feedstocks using biochar production
Components
Woodchip
(Yargicoglu
et al. 2015)
Grass
(Jouiada
et al. 2015;
Mohammed
et al. 2015)
Poultry
litter
(Jindo
et al.
2012)
Rice husk
(Shackley
et al.
2012)
Sugarcane
bagasse
(Carriea
et al. 2012)
Wheat
straw
(Mahinpey
et al. 2009;
Bruun et al.
2012)
Soil C (%)
74.5
–
71.47
–
–
–
Ash (%)
25.4
14.7
28.53
6.5
11.9–16.4
5.9
pH
7.88
6.1
23.596
6.6
–
6.76
EC
(mS cm
À1
)
0.14
–
3.0
–
–
2770
CEC (c mol
kg
À1
)
–
–
–
45–110
–
–
C (%)
51.9
42.5
38.6
41
60.4–65.3
43.7
N (%)
0.4
1.9
1.37
1.4
0.8–1.0
0.9
S (%)
–
5.3
–
0.1
25.4–15.1
0.283
Ca (ppm)
0.56
4.3 4
1.85
250
–
0.18
K (ppm)
0.21
64.80
0.99
2604
–
0.15
Mg (ppm)
0.04
2.3 4
0.19
827
–
–
Si mg kg
À1
–
7.44
–
5.8
–
0.18
P (ppm)
0.06
2.31
0.35
–
–
0.05
Adapted from Singh et al. (2017a, b, c)
478
C. Singh et al.
Development
The biochar can play multidisciplinary role in agricultural and environmental sustainability development due the longtime persistent nature in soil. The higher
concentration of stable organic matter with carbon contents was found of about
70–80% (Lehmann et al. 2002; Singh et al. 2017a) and mineral matter, including
nutrients, in higher quantity. Pyrolyzed biomass of agricultural waste has high
surface area, porosity, variable charge, and functional groups (Fig. 19.1) that can
increase soil water-holding capacity, pH, cation exchange capacity (CEC), base
saturation, bioremediation of hydrocarbons and heavy metals, and finally crop
resistance to disease when added to soil in adequate amount (Glaser et al. 2002;
Keech et al. 2005; Liang et al. 2006; Tang et al. 2013). These properties vary with
the pyrolysis temperature and types of feedstocks (Gundale and DeLuca 2006;
Bornermann et al. 2007; Chan and Xu 2009; Singh et al. 2010, 2017b). Biochar
application to soil is widely advocated for a variety of reasons related to sustainability (Jeffery et al. 2015). The most often claimed benefits of biochar include carbon
sequestration, soil fertility improvement, pollutant immobilization, pollutant remediation, and waste management. Furthermore, the additions of biochar to soil can
increase bacterial abundance that involve in bioremediation of soil pollutants and
reduce soil bulk density (Gundale and DeLuca 2006). Biochar strongly adsorbed
Table 19.1 Physicochemical properties of different feedstocks using biochar production
Components
Woodchip
(Yargicoglu
et al. 2015)
Grass
(Jouiada
et al. 2015;
Mohammed
et al. 2015)
Poultry
litter
(Jindo
et al.
2012)
Rice husk
(Shackley
et al.
2012)
Sugarcane
bagasse
(Carriea
et al. 2012)
Wheat
straw
(Mahinpey
et al. 2009;
Bruun et al.
2012)
Soil C (%)
74.5
–
71.47
–
–
–
Ash (%)
25.4
14.7
28.53
6.5
11.9–16.4
5.9
pH
7.88
6.1
23.596
6.6
–
6.76
EC
(mS cm
À1
)
0.14
–
3.0
–
–
2770
CEC (c mol
kg
À1
)
–
–
–
45–110
–
–
C (%)
51.9
42.5
38.6
41
60.4–65.3
43.7
N (%)
0.4
1.9
1.37
1.4
0.8–1.0
0.9
S (%)
–
5.3
–
0.1
25.4–15.1
0.283
Ca (ppm)
0.56
4.3 4
1.85
250
–
0.18
K (ppm)
0.21
64.80
0.99
2604
–
0.15
Mg (ppm)
0.04
2.3 4
0.19
827
–
–
Si mg kg
À1
–
7.44
–
5.8
–
0.18
P (ppm)
0.06
2.31
0.35
–
–
0.05
Adapted from Singh et al. (2017a, b, c)
478
C. Singh et al.