

Forest Resources of Jharkhand, Eastern India …
81
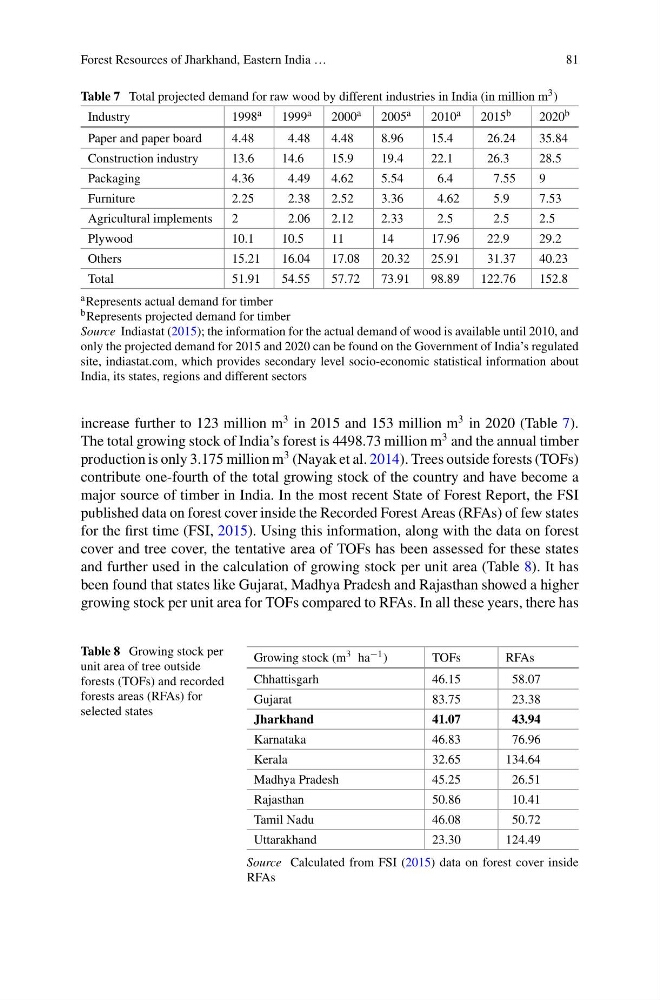
Table 7 Total projected demand for raw wood by different industries in India (in million m 3 )
Industry
1998 a
1999 a
2000 a
2005 a
2010 a
2015 b
2020 b
Paper and paper board
4.48
4.48
4.48
8.96
15.4
26.24
35.84
Construction industry
13.6
14.6
15.9
19.4
22.1
26.3
28.5
Packaging
4.36
4.49
4.62
5.54
6.4
7.55
9
Furniture
2.25
2.38
2.52
3.36
4.62
5.9
7.53
Agricultural implements
2
2.06
2.12
2.33
2.5
2.5
2.5
Plywood
10.1
10.5
11
14
17.96
22.9
29.2
Others
15.21
16.04
17.08
20.32
25.91
31.37
40.23
Total
51.91
54.55
57.72
73.91
98.89
122.76
152.8
a Represents actual demand for timber
b Represents projected demand for timber
Source Indiastat (2015); the information for the actual demand of wood is available until 2010, and
only the projected demand for 2015 and 2020 can be found on the Government of India’s regulated
site, indiastat.com, which provides secondary level socio-economic statistical information about
India, its states, regions and different sectors
increase further to 123 million m
3 in 2015 and 153 million m
3 in 2020 (Table 7).
The total growing stock of India’s forest is 4498.73 million m
3 and the annual timber
production is only 3.175 million m
3 (Nayak et al. 2014). Trees outside forests (TOFs)
contribute one-fourth of the total growing stock of the country and have become a
major source of timber in India. In the most recent State of Forest Report, the FSI
published data on forest cover inside the Recorded Forest Areas (RFAs) of few states
for the first time (FSI, 2015). Using this information, along with the data on forest
cover and tree cover, the tentative area of TOFs has been assessed for these states
and further used in the calculation of growing stock per unit area (Table 8). It has
been found that states like Gujarat, Madhya Pradesh and Rajasthan showed a higher
growing stock per unit area for TOFs compared to RFAs. In all these years, there has
Table 8 Growing stock per
unit area of tree outside
forests (TOFs) and recorded
forests areas (RFAs) for
selected states
Growing stock (m 3 ha −1 )
TOFs
RFAs
Chhattisgarh
46.15
58.07
Gujarat
83.75
23.38
Jharkhand
41.07
43.94
Karnataka
46.83
76.96
Kerala
32.65
134.64
Madhya Pradesh
45.25
26.51
Rajasthan
50.86
10.41
Tamil Nadu
46.08
50.72
Uttarakhand
23.30
124.49
Source Calculated from FSI (2015) data on forest cover inside
RFAs
81
Table 7 Total projected demand for raw wood by different industries in India (in million m 3 )
Industry
1998 a
1999 a
2000 a
2005 a
2010 a
2015 b
2020 b
Paper and paper board
4.48
4.48
4.48
8.96
15.4
26.24
35.84
Construction industry
13.6
14.6
15.9
19.4
22.1
26.3
28.5
Packaging
4.36
4.49
4.62
5.54
6.4
7.55
9
Furniture
2.25
2.38
2.52
3.36
4.62
5.9
7.53
Agricultural implements
2
2.06
2.12
2.33
2.5
2.5
2.5
Plywood
10.1
10.5
11
14
17.96
22.9
29.2
Others
15.21
16.04
17.08
20.32
25.91
31.37
40.23
Total
51.91
54.55
57.72
73.91
98.89
122.76
152.8
a Represents actual demand for timber
b Represents projected demand for timber
Source Indiastat (2015); the information for the actual demand of wood is available until 2010, and
only the projected demand for 2015 and 2020 can be found on the Government of India’s regulated
site, indiastat.com, which provides secondary level socio-economic statistical information about
India, its states, regions and different sectors
increase further to 123 million m
3 in 2015 and 153 million m
3 in 2020 (Table 7).
The total growing stock of India’s forest is 4498.73 million m
3 and the annual timber
production is only 3.175 million m
3 (Nayak et al. 2014). Trees outside forests (TOFs)
contribute one-fourth of the total growing stock of the country and have become a
major source of timber in India. In the most recent State of Forest Report, the FSI
published data on forest cover inside the Recorded Forest Areas (RFAs) of few states
for the first time (FSI, 2015). Using this information, along with the data on forest
cover and tree cover, the tentative area of TOFs has been assessed for these states
and further used in the calculation of growing stock per unit area (Table 8). It has
been found that states like Gujarat, Madhya Pradesh and Rajasthan showed a higher
growing stock per unit area for TOFs compared to RFAs. In all these years, there has
Table 8 Growing stock per
unit area of tree outside
forests (TOFs) and recorded
forests areas (RFAs) for
selected states
Growing stock (m 3 ha −1 )
TOFs
RFAs
Chhattisgarh
46.15
58.07
Gujarat
83.75
23.38
Jharkhand
41.07
43.94
Karnataka
46.83
76.96
Kerala
32.65
134.64
Madhya Pradesh
45.25
26.51
Rajasthan
50.86
10.41
Tamil Nadu
46.08
50.72
Uttarakhand
23.30
124.49
Source Calculated from FSI (2015) data on forest cover inside
RFAs