

Spatial Shift in Chickpeas in India
417
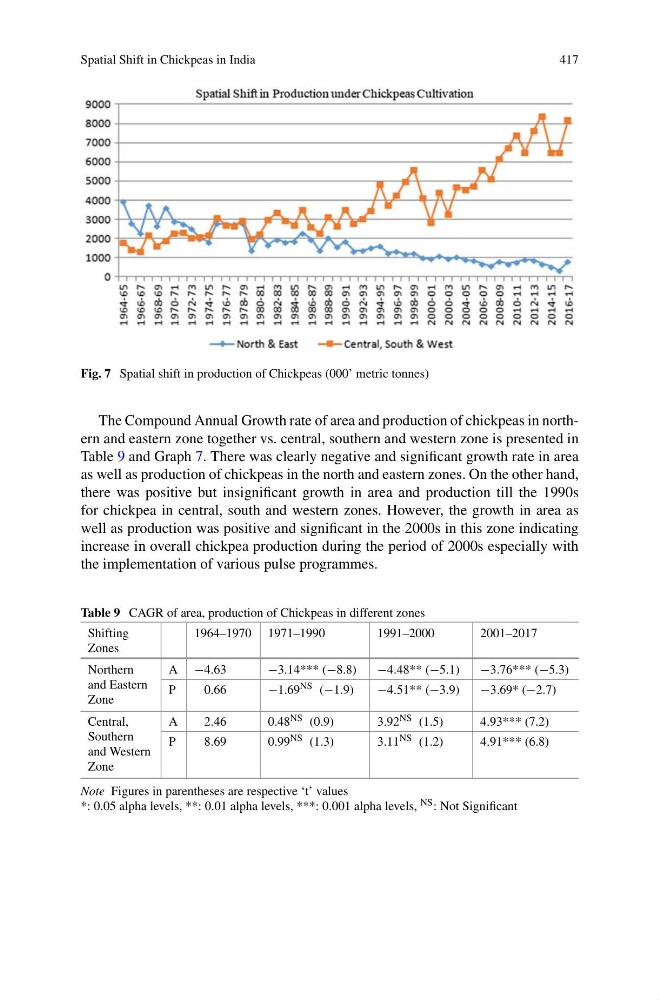
Fig. 7 Spatial shift in production of Chickpeas (000’ metric tonnes)
The Compound Annual Growth rate of area and production of chickpeas in northern and eastern zone together vs. central, southern and western zone is presented in
Table 9 and Graph 7. There was clearly negative and significant growth rate in area
as well as production of chickpeas in the north and eastern zones. On the other hand,
there was positive but insignificant growth in area and production till the 1990s
for chickpea in central, south and western zones. However, the growth in area as
well as production was positive and significant in the 2000s in this zone indicating
increase in overall chickpea production during the period of 2000s especially with
the implementation of various pulse programmes.
Table 9 CAGR of area, production of Chickpeas in different zones
Shifting
Zones
1964–1970 1971–1990
1991–2000
2001–2017
Northern
and Eastern
Zone
A −4.63
−3.14*** (−8.8)
−4.48** (−5.1)
−3.76*** (−5.3)
P
0.66
−1.69 NS (−1.9)
−4.51** (−3.9)
−3.69* (−2.7)
Central,
Southern
and Western
Zone
A
2.46
0.48 NS (0.9)
3.92 NS (1.5)
4.93*** (7.2)
P
8.69
0.99 NS (1.3)
3.11 NS (1.2)
4.91*** (6.8)
Note Figures in parentheses are respective ‘t’ values
*: 0.05 alpha levels, **: 0.01 alpha levels, ***: 0.001 alpha levels, NS : Not Significant
417
Fig. 7 Spatial shift in production of Chickpeas (000’ metric tonnes)
The Compound Annual Growth rate of area and production of chickpeas in northern and eastern zone together vs. central, southern and western zone is presented in
Table 9 and Graph 7. There was clearly negative and significant growth rate in area
as well as production of chickpeas in the north and eastern zones. On the other hand,
there was positive but insignificant growth in area and production till the 1990s
for chickpea in central, south and western zones. However, the growth in area as
well as production was positive and significant in the 2000s in this zone indicating
increase in overall chickpea production during the period of 2000s especially with
the implementation of various pulse programmes.
Table 9 CAGR of area, production of Chickpeas in different zones
Shifting
Zones
1964–1970 1971–1990
1991–2000
2001–2017
Northern
and Eastern
Zone
A −4.63
−3.14*** (−8.8)
−4.48** (−5.1)
−3.76*** (−5.3)
P
0.66
−1.69 NS (−1.9)
−4.51** (−3.9)
−3.69* (−2.7)
Central,
Southern
and Western
Zone
A
2.46
0.48 NS (0.9)
3.92 NS (1.5)
4.93*** (7.2)
P
8.69
0.99 NS (1.3)
3.11 NS (1.2)
4.91*** (6.8)
Note Figures in parentheses are respective ‘t’ values
*: 0.05 alpha levels, **: 0.01 alpha levels, ***: 0.001 alpha levels, NS : Not Significant