

416
B. Abirami and P. Kumar
Table 8 CAGR of Area, Production and Productivity of Chickpeas in Central Zone (1964–2017)
State
1964–1970
1971–1990
1991–2000
2001–2017
Madhya Pradesh
A
1.8
1.7*** (6.4)
0.2 NS (0.2)
1.6*** (4.5)
P
2.92
2.64*** (4.9)
2.02 NS (1.05)
3.71*** (4.13)
Y
1.28
0.91 NS (1.8)
1.80 NS (1.87)
1.99** (3.1)
Chhattisgarh
A
–
–
–
3.56*** (12.9)
P
–
–
–
7.92** (3.6)
Y
–
–
–
2.51** (2.6)
Note Figures in parentheses are respective ‘t’ values
*: 0.05 alpha levels, **: 0.01 alpha levels, ***: 0.001 alpha levels, NS : Not Significant
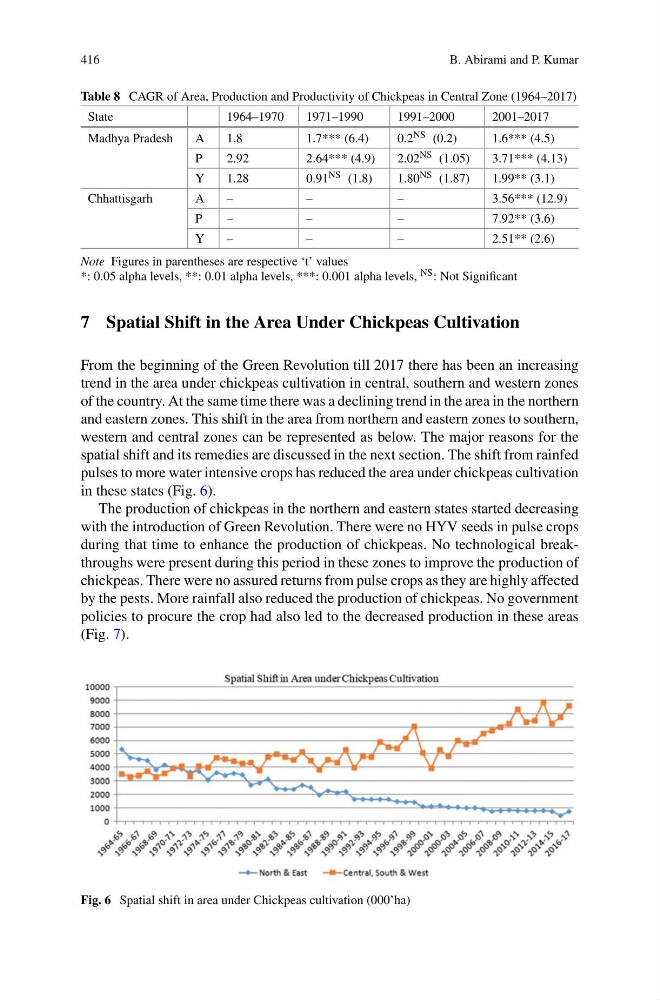
7 Spatial Shift in the Area Under Chickpeas Cultivation
From the beginning of the Green Revolution till 2017 there has been an increasing
trend in the area under chickpeas cultivation in central, southern and western zones
of the country. At the same time there was a declining trend in the area in the northern
and eastern zones. This shift in the area from northern and eastern zones to southern,
western and central zones can be represented as below. The major reasons for the
spatial shift and its remedies are discussed in the next section. The shift from rainfed
pulses to more water intensive crops has reduced the area under chickpeas cultivation
in these states (Fig. 6).
The production of chickpeas in the northern and eastern states started decreasing
with the introduction of Green Revolution. There were no HYV seeds in pulse crops
during that time to enhance the production of chickpeas. No technological breakthroughs were present during this period in these zones to improve the production of
chickpeas. There were no assured returns from pulse crops as they are highly affected
by the pests. More rainfall also reduced the production of chickpeas. No government
policies to procure the crop had also led to the decreased production in these areas
(Fig. 7).
Fig. 6 Spatial shift in area under Chickpeas cultivation (000’ha)
B. Abirami and P. Kumar
Table 8 CAGR of Area, Production and Productivity of Chickpeas in Central Zone (1964–2017)
State
1964–1970
1971–1990
1991–2000
2001–2017
Madhya Pradesh
A
1.8
1.7*** (6.4)
0.2 NS (0.2)
1.6*** (4.5)
P
2.92
2.64*** (4.9)
2.02 NS (1.05)
3.71*** (4.13)
Y
1.28
0.91 NS (1.8)
1.80 NS (1.87)
1.99** (3.1)
Chhattisgarh
A
–
–
–
3.56*** (12.9)
P
–
–
–
7.92** (3.6)
Y
–
–
–
2.51** (2.6)
Note Figures in parentheses are respective ‘t’ values
*: 0.05 alpha levels, **: 0.01 alpha levels, ***: 0.001 alpha levels, NS : Not Significant
7 Spatial Shift in the Area Under Chickpeas Cultivation
From the beginning of the Green Revolution till 2017 there has been an increasing
trend in the area under chickpeas cultivation in central, southern and western zones
of the country. At the same time there was a declining trend in the area in the northern
and eastern zones. This shift in the area from northern and eastern zones to southern,
western and central zones can be represented as below. The major reasons for the
spatial shift and its remedies are discussed in the next section. The shift from rainfed
pulses to more water intensive crops has reduced the area under chickpeas cultivation
in these states (Fig. 6).
The production of chickpeas in the northern and eastern states started decreasing
with the introduction of Green Revolution. There were no HYV seeds in pulse crops
during that time to enhance the production of chickpeas. No technological breakthroughs were present during this period in these zones to improve the production of
chickpeas. There were no assured returns from pulse crops as they are highly affected
by the pests. More rainfall also reduced the production of chickpeas. No government
policies to procure the crop had also led to the decreased production in these areas
(Fig. 7).
Fig. 6 Spatial shift in area under Chickpeas cultivation (000’ha)