

Spatial Shift in Chickpeas in India
411
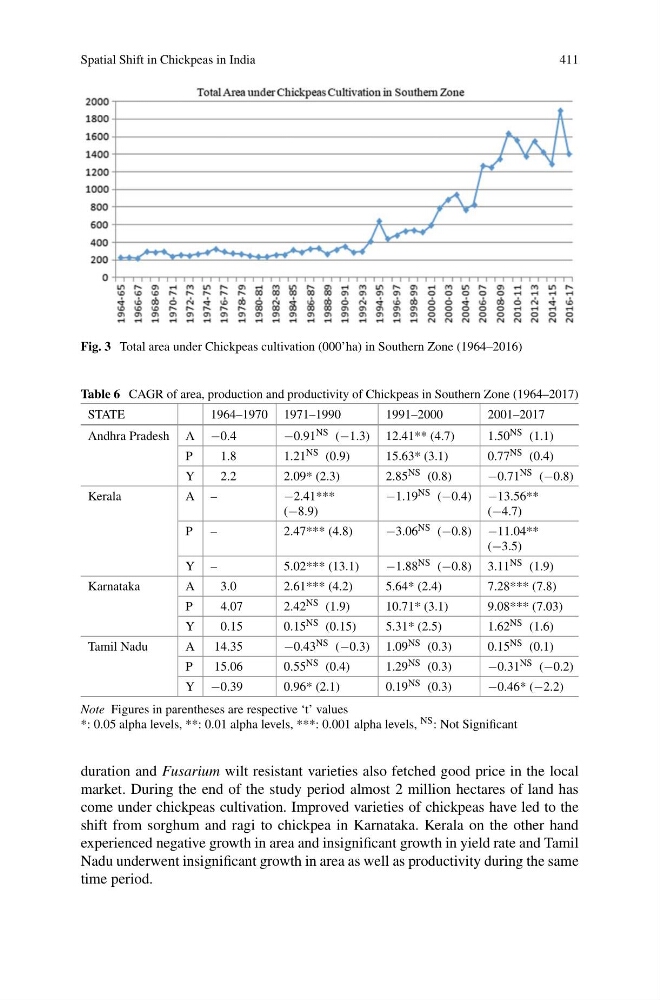
Fig. 3 Total area under Chickpeas cultivation (000’ha) in Southern Zone (1964–2016)
Table 6 CAGR of area, production and productivity of Chickpeas in Southern Zone (1964–2017)
STATE
1964–1970 1971–1990
1991–2000
2001–2017
Andhra Pradesh A −0.4
−0.91 NS (−1.3) 12.41** (4.7)
1.50 NS (1.1)
P
1.8
1.21 NS (0.9)
15.63* (3.1)
0.77 NS (0.4)
Y
2.2
2.09* (2.3)
2.85 NS (0.8)
−0.71 NS (−0.8)
Kerala
A –
−2.41***
(−8.9)
−1.19 NS (−0.4) −13.56**
(−4.7)
P –
2.47*** (4.8)
−3.06 NS (−0.8) −11.04**
(−3.5)
Y –
5.02*** (13.1)
−1.88 NS (−0.8) 3.11 NS (1.9)
Karnataka
A
3.0
2.61*** (4.2)
5.64* (2.4)
7.28*** (7.8)
P
4.07
2.42 NS (1.9)
10.71* (3.1)
9.08*** (7.03)
Y
0.15
0.15 NS (0.15)
5.31* (2.5)
1.62 NS (1.6)
Tamil Nadu
A
14.35
−0.43 NS (−0.3) 1.09 NS (0.3)
0.15 NS (0.1)
P
15.06
0.55 NS (0.4)
1.29 NS (0.3)
−0.31 NS (−0.2)
Y −0.39
0.96* (2.1)
0.19 NS (0.3)
−0.46* (−2.2)
Note Figures in parentheses are respective ‘t’ values
*: 0.05 alpha levels, **: 0.01 alpha levels, ***: 0.001 alpha levels, NS : Not Significant
duration and Fusarium wilt resistant varieties also fetched good price in the local
market. During the end of the study period almost 2 million hectares of land has
come under chickpeas cultivation. Improved varieties of chickpeas have led to the
shift from sorghum and ragi to chickpea in Karnataka. Kerala on the other hand
experienced negative growth in area and insignificant growth in yield rate and Tamil
Nadu underwent insignificant growth in area as well as productivity during the same
time period.
411
Fig. 3 Total area under Chickpeas cultivation (000’ha) in Southern Zone (1964–2016)
Table 6 CAGR of area, production and productivity of Chickpeas in Southern Zone (1964–2017)
STATE
1964–1970 1971–1990
1991–2000
2001–2017
Andhra Pradesh A −0.4
−0.91 NS (−1.3) 12.41** (4.7)
1.50 NS (1.1)
P
1.8
1.21 NS (0.9)
15.63* (3.1)
0.77 NS (0.4)
Y
2.2
2.09* (2.3)
2.85 NS (0.8)
−0.71 NS (−0.8)
Kerala
A –
−2.41***
(−8.9)
−1.19 NS (−0.4) −13.56**
(−4.7)
P –
2.47*** (4.8)
−3.06 NS (−0.8) −11.04**
(−3.5)
Y –
5.02*** (13.1)
−1.88 NS (−0.8) 3.11 NS (1.9)
Karnataka
A
3.0
2.61*** (4.2)
5.64* (2.4)
7.28*** (7.8)
P
4.07
2.42 NS (1.9)
10.71* (3.1)
9.08*** (7.03)
Y
0.15
0.15 NS (0.15)
5.31* (2.5)
1.62 NS (1.6)
Tamil Nadu
A
14.35
−0.43 NS (−0.3) 1.09 NS (0.3)
0.15 NS (0.1)
P
15.06
0.55 NS (0.4)
1.29 NS (0.3)
−0.31 NS (−0.2)
Y −0.39
0.96* (2.1)
0.19 NS (0.3)
−0.46* (−2.2)
Note Figures in parentheses are respective ‘t’ values
*: 0.05 alpha levels, **: 0.01 alpha levels, ***: 0.001 alpha levels, NS : Not Significant
duration and Fusarium wilt resistant varieties also fetched good price in the local
market. During the end of the study period almost 2 million hectares of land has
come under chickpeas cultivation. Improved varieties of chickpeas have led to the
shift from sorghum and ragi to chickpea in Karnataka. Kerala on the other hand
experienced negative growth in area and insignificant growth in yield rate and Tamil
Nadu underwent insignificant growth in area as well as productivity during the same
time period.