

374
Shalabh and S. S. Dhar
> lm.ridge(rain~
windspeed+precipitation+relhum+cars+popden+alutox,lambda=
seq(0,1,.2))
windspeed precipitation
relhum
cars
popden
alutox
0.0 29.24835 1.2911823
0.4562941 1.0678158 -0.0030430549 0.0001521330 0.003586288
0.2 33.29369 1.1479505
0.5205957 0.9924218 -0.0021725209 0.0006840642 0.004541111
0.4 36.74316 1.0349178
0.5636149 0.9327653 -0.0015199226 0.0010362769 0.005292330
0.6 39.74976 0.9429626
0.5928507 0.8840151 -0.0010136254 0.0012739009 0.005895906
0.8 42.41405 0.8663818
0.6127803 0.8431706 -0.0006101323 0.0014354703 0.006388244
1.0 44.80577 0.8014090
0.6262195 0.8082632 -0.0002815602 0.0015449756 0.006794311
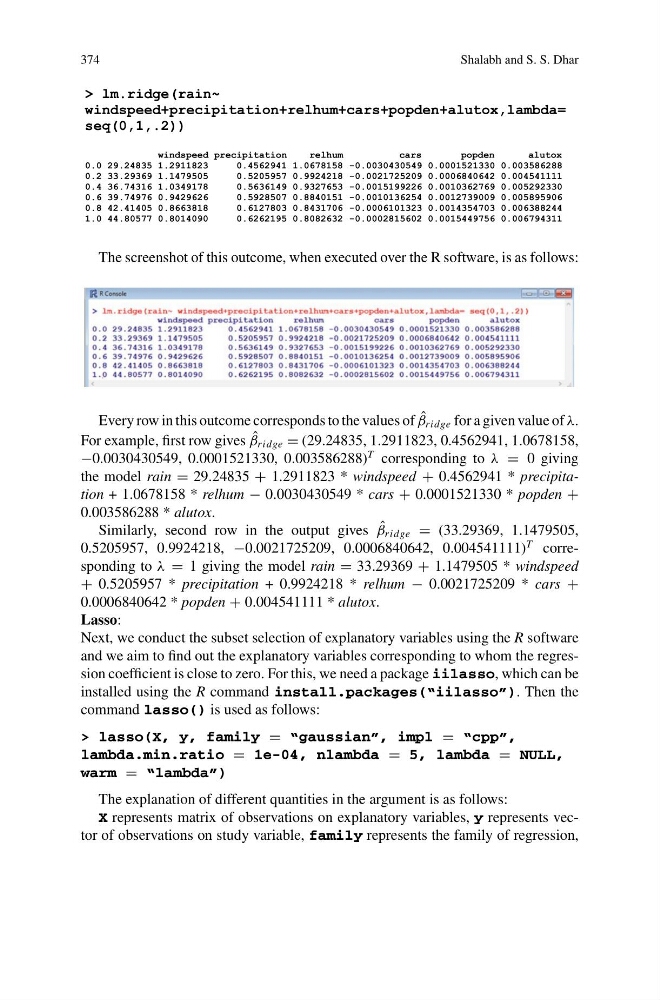
The screenshot of this outcome, when executed over the R software, is as follows:
Every row in this outcome corresponds to the values of ˆ
β ridge for a given value of λ.
For example, first row gives ˆ
β ridge = (29.24835, 1.2911823, 0.4562941, 1.0678158,
−0.0030430549, 0.0001521330, 0.003586288)
T corresponding to λ = 0 giving
the model rain = 29.24835 + 1.2911823 * windspeed + 0.4562941 * precipitation + 1.0678158 * relhum − 0.0030430549 * cars + 0.0001521330 * popden +
0.003586288 * alutox.
Similarly, second row in the output gives ˆ
β ridge = (33.29369, 1.1479505,
0.5205957, 0.9924218, −0.0021725209, 0.0006840642, 0.004541111)
T corresponding to λ = 1 giving the model rain = 33.29369 + 1.1479505 * windspeed
+ 0.5205957 * precipitation + 0.9924218 * relhum − 0.0021725209 * cars +
0.0006840642 * popden + 0.004541111 * alutox.
Lasso:
Next, we conduct the subset selection of explanatory variables using the R software
and we aim to find out the explanatory variables corresponding to whom the regression coefficient is close to zero. For this, we need a package iilasso, which can be
installed using the R command install.packages(“iilasso”). Then the
command lasso() is used as follows:
> lasso(X, y, family = “gaussian”, impl = “cpp”,
lambda.min.ratio = 1e-04, nlambda = 5, lambda = NULL,
warm = “lambda”)
The explanation of different quantities in the argument is as follows:
X represents matrix of observations on explanatory variables, y represents vector of observations on study variable, family represents the family of regression,
Shalabh and S. S. Dhar
> lm.ridge(rain~
windspeed+precipitation+relhum+cars+popden+alutox,lambda=
seq(0,1,.2))
windspeed precipitation
relhum
cars
popden
alutox
0.0 29.24835 1.2911823
0.4562941 1.0678158 -0.0030430549 0.0001521330 0.003586288
0.2 33.29369 1.1479505
0.5205957 0.9924218 -0.0021725209 0.0006840642 0.004541111
0.4 36.74316 1.0349178
0.5636149 0.9327653 -0.0015199226 0.0010362769 0.005292330
0.6 39.74976 0.9429626
0.5928507 0.8840151 -0.0010136254 0.0012739009 0.005895906
0.8 42.41405 0.8663818
0.6127803 0.8431706 -0.0006101323 0.0014354703 0.006388244
1.0 44.80577 0.8014090
0.6262195 0.8082632 -0.0002815602 0.0015449756 0.006794311
The screenshot of this outcome, when executed over the R software, is as follows:
Every row in this outcome corresponds to the values of ˆ
β ridge for a given value of λ.
For example, first row gives ˆ
β ridge = (29.24835, 1.2911823, 0.4562941, 1.0678158,
−0.0030430549, 0.0001521330, 0.003586288)
T corresponding to λ = 0 giving
the model rain = 29.24835 + 1.2911823 * windspeed + 0.4562941 * precipitation + 1.0678158 * relhum − 0.0030430549 * cars + 0.0001521330 * popden +
0.003586288 * alutox.
Similarly, second row in the output gives ˆ
β ridge = (33.29369, 1.1479505,
0.5205957, 0.9924218, −0.0021725209, 0.0006840642, 0.004541111)
T corresponding to λ = 1 giving the model rain = 33.29369 + 1.1479505 * windspeed
+ 0.5205957 * precipitation + 0.9924218 * relhum − 0.0021725209 * cars +
0.0006840642 * popden + 0.004541111 * alutox.
Lasso:
Next, we conduct the subset selection of explanatory variables using the R software
and we aim to find out the explanatory variables corresponding to whom the regression coefficient is close to zero. For this, we need a package iilasso, which can be
installed using the R command install.packages(“iilasso”). Then the
command lasso() is used as follows:
> lasso(X, y, family = “gaussian”, impl = “cpp”,
lambda.min.ratio = 1e-04, nlambda = 5, lambda = NULL,
warm = “lambda”)
The explanation of different quantities in the argument is as follows:
X represents matrix of observations on explanatory variables, y represents vector of observations on study variable, family represents the family of regression,