

Statistical Modelling and Variable Selection in Climate Science
373
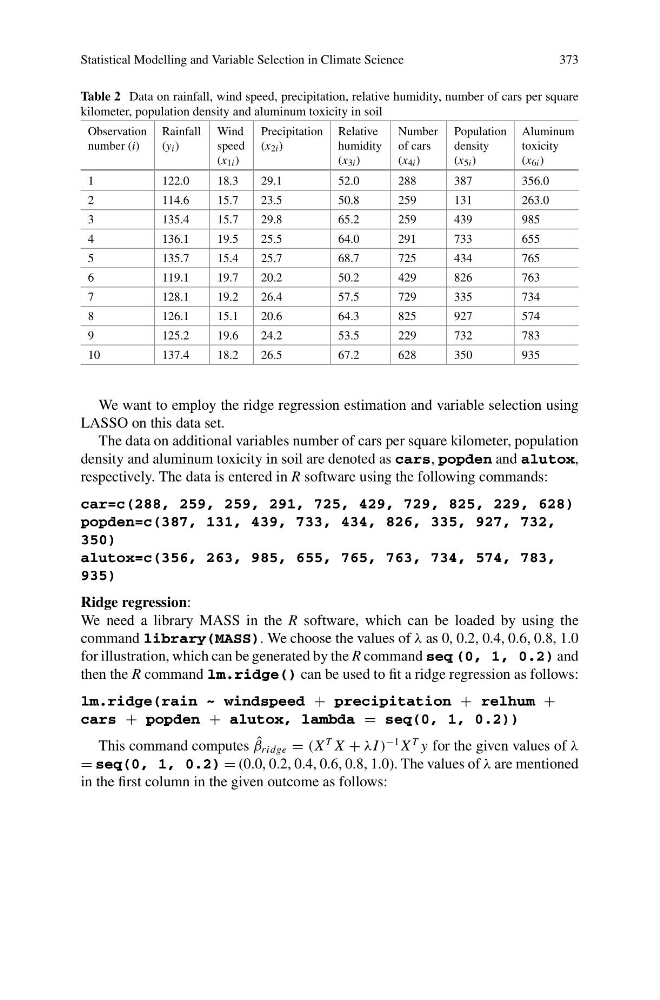
Table 2 Data on rainfall, wind speed, precipitation, relative humidity, number of cars per square
kilometer, population density and aluminum toxicity in soil
Observation
number (i)
Rainfall
(y i )
Wind
speed
(x 1i )
Precipitation
(x 2i )
Relative
humidity
(x 3i )
Number
of cars
(x 4i )
Population
density
(x 5i )
Aluminum
toxicity
(x 6i )
1
122.0
18.3
29.1
52.0
288
387
356.0
2
114.6
15.7
23.5
50.8
259
131
263.0
3
135.4
15.7
29.8
65.2
259
439
985
4
136.1
19.5
25.5
64.0
291
733
655
5
135.7
15.4
25.7
68.7
725
434
765
6
119.1
19.7
20.2
50.2
429
826
763
7
128.1
19.2
26.4
57.5
729
335
734
8
126.1
15.1
20.6
64.3
825
927
574
9
125.2
19.6
24.2
53.5
229
732
783
10
137.4
18.2
26.5
67.2
628
350
935
We want to employ the ridge regression estimation and variable selection using
LASSO on this data set.
The data on additional variables number of cars per square kilometer, population
density and aluminum toxicity in soil are denoted as cars, popden and alutox,
respectively. The data is entered in R software using the following commands:
car=c(288, 259, 259, 291, 725, 429, 729, 825, 229, 628)
popden=c(387, 131, 439, 733, 434, 826, 335, 927, 732,
350)
alutox=c(356, 263, 985, 655, 765, 763, 734, 574, 783,
935)
Ridge regression:
We need a library MASS in the R software, which can be loaded by using the
command library(MASS). We choose the values of λ as 0, 0.2, 0.4, 0.6, 0.8, 1.0
for illustration, which can be generated by the R command seq (0, 1, 0.2) and
then the R command lm.ridge() can be used to fit a ridge regression as follows:
lm.ridge(rain ~ windspeed + precipitation + relhum +
cars + popden + alutox, lambda = seq(0, 1, 0.2))
This command computes ˆ
β ridge = (X
T X + λI )
−1 X
T y for the given values of λ
= seq(0, 1, 0.2) = (0.0, 0.2, 0.4, 0.6, 0.8, 1.0). The values of λ are mentioned
in the first column in the given outcome as follows:
373
Table 2 Data on rainfall, wind speed, precipitation, relative humidity, number of cars per square
kilometer, population density and aluminum toxicity in soil
Observation
number (i)
Rainfall
(y i )
Wind
speed
(x 1i )
Precipitation
(x 2i )
Relative
humidity
(x 3i )
Number
of cars
(x 4i )
Population
density
(x 5i )
Aluminum
toxicity
(x 6i )
1
122.0
18.3
29.1
52.0
288
387
356.0
2
114.6
15.7
23.5
50.8
259
131
263.0
3
135.4
15.7
29.8
65.2
259
439
985
4
136.1
19.5
25.5
64.0
291
733
655
5
135.7
15.4
25.7
68.7
725
434
765
6
119.1
19.7
20.2
50.2
429
826
763
7
128.1
19.2
26.4
57.5
729
335
734
8
126.1
15.1
20.6
64.3
825
927
574
9
125.2
19.6
24.2
53.5
229
732
783
10
137.4
18.2
26.5
67.2
628
350
935
We want to employ the ridge regression estimation and variable selection using
LASSO on this data set.
The data on additional variables number of cars per square kilometer, population
density and aluminum toxicity in soil are denoted as cars, popden and alutox,
respectively. The data is entered in R software using the following commands:
car=c(288, 259, 259, 291, 725, 429, 729, 825, 229, 628)
popden=c(387, 131, 439, 733, 434, 826, 335, 927, 732,
350)
alutox=c(356, 263, 985, 655, 765, 763, 734, 574, 783,
935)
Ridge regression:
We need a library MASS in the R software, which can be loaded by using the
command library(MASS). We choose the values of λ as 0, 0.2, 0.4, 0.6, 0.8, 1.0
for illustration, which can be generated by the R command seq (0, 1, 0.2) and
then the R command lm.ridge() can be used to fit a ridge regression as follows:
lm.ridge(rain ~ windspeed + precipitation + relhum +
cars + popden + alutox, lambda = seq(0, 1, 0.2))
This command computes ˆ
β ridge = (X
T X + λI )
−1 X
T y for the given values of λ
= seq(0, 1, 0.2) = (0.0, 0.2, 0.4, 0.6, 0.8, 1.0). The values of λ are mentioned
in the first column in the given outcome as follows: