

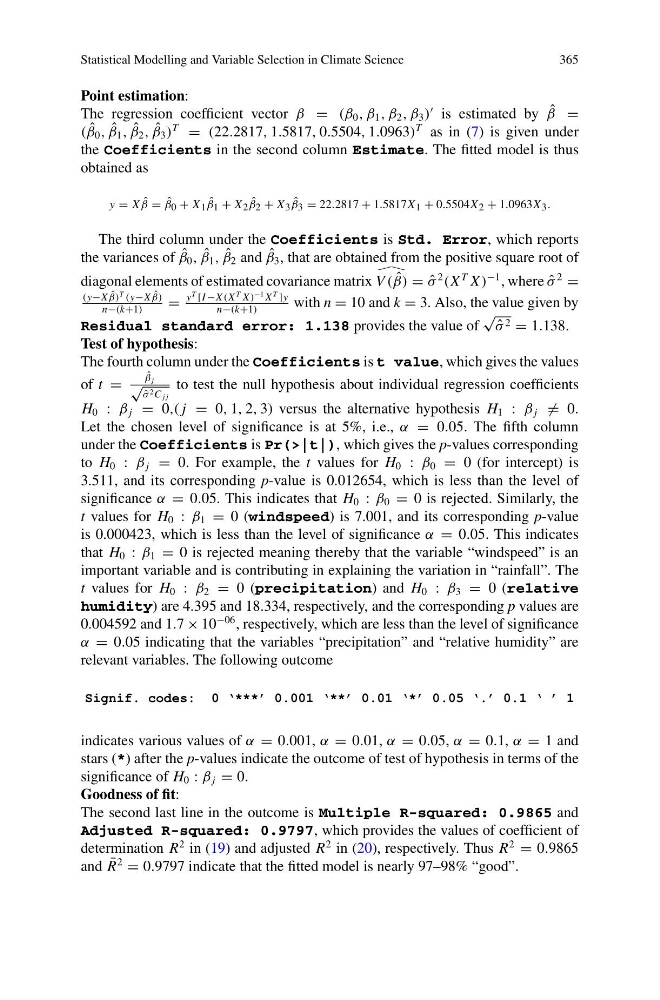
Statistical Modelling and Variable Selection in Climate Science
365
Point estimation:
The regression coefficient vector β = (β 0 , β 1 , β 2 , β 3 )
is estimated by ˆ
β =
( ˆ
β 0 , ˆ
β 1 , ˆ
β 2 , ˆ
β 3 )
T
= (22.2817, 1.5817, 0.5504, 1.0963)
T as in (7) is given under
the Coefficients in the second column Estimate. The fitted model is thus
obtained as
y = X ˆ
β = ˆ
β 0 + X 1 ˆ
β 1 + X 2 ˆ
β 2 + X 3 ˆ
β 3 = 22.2817 + 1.5817X 1 + 0.5504X 2 + 1.0963X 3 .
The third column under the Coefficients is Std. Error, which reports
the variances of ˆ
β 0 , ˆ
β 1 , ˆ
β 2 and ˆ
β 3 , that are obtained from the positive square root of
diagonal elements of estimated covariance matrix V ( ˆ
β)
= ˆ
σ
2
(X
T X )
−1 , where ˆ
σ
2
=
(y−X ˆ
β)
T (y−X ˆ
β)
n−(k+1)
=
y
T [I −X (X
T X )
−1 X
T ]y
n−(k+1)
with n = 10 and k = 3. Also, the value given by
Residual standard error: 1.138 provides the value of
√ ˆ
σ 2 = 1.138.
Test of hypothesis:
The fourth column under the Coefficients is t value, which gives the values
of t =
ˆ
β j
√ ˆ
σ 2 C j j
to test the null hypothesis about individual regression coefficients
H 0 : β j = 0,( j = 0, 1, 2, 3) versus the alternative hypothesis H 1 : β j = 0.
Let the chosen level of significance is at 5%, i.e., α = 0.05. The fifth column
under the Coefficients is Pr(>|t|), which gives the p-values corresponding
to H 0 : β j = 0. For example, the t values for H 0 : β 0 = 0 (for intercept) is
3.511, and its corresponding p-value is 0.012654, which is less than the level of
significance α = 0.05. This indicates that H 0 : β 0 = 0 is rejected. Similarly, the
t values for H 0 : β 1 = 0 (windspeed) is 7.001, and its corresponding p-value
is 0.000423, which is less than the level of significance α = 0.05. This indicates
that H 0 : β 1 = 0 is rejected meaning thereby that the variable “windspeed” is an
important variable and is contributing in explaining the variation in “rainfall”. The
t values for H 0 : β 2 = 0 (precipitation) and H 0 : β 3 = 0 (relative
humidity) are 4.395 and 18.334, respectively, and the corresponding p values are
0.004592 and 1.7 × 10
−06 , respectively, which are less than the level of significance
α = 0.05 indicating that the variables “precipitation” and “relative humidity” are
relevant variables. The following outcome
Signif. codes: 0 ‘***’ 0.001 ‘**’ 0.01 ‘*’ 0.05 ‘.’ 0.1 ‘ ’ 1
indicates various values of α = 0.001, α = 0.01, α = 0.05, α = 0.1, α = 1 and
stars (*) after the p-values indicate the outcome of test of hypothesis in terms of the
significance of H 0 : β j = 0.
Goodness of fit:
The second last line in the outcome is Multiple R-squared: 0.9865 and
Adjusted R-squared: 0.9797, which provides the values of coefficient of
determination R
2 in (19) and adjusted R
2 in (20), respectively. Thus R
2
= 0.9865
and ¯
R
2
= 0.9797 indicate that the fitted model is nearly 97–98% “good”.
365
Point estimation:
The regression coefficient vector β = (β 0 , β 1 , β 2 , β 3 )
is estimated by ˆ
β =
( ˆ
β 0 , ˆ
β 1 , ˆ
β 2 , ˆ
β 3 )
T
= (22.2817, 1.5817, 0.5504, 1.0963)
T as in (7) is given under
the Coefficients in the second column Estimate. The fitted model is thus
obtained as
y = X ˆ
β = ˆ
β 0 + X 1 ˆ
β 1 + X 2 ˆ
β 2 + X 3 ˆ
β 3 = 22.2817 + 1.5817X 1 + 0.5504X 2 + 1.0963X 3 .
The third column under the Coefficients is Std. Error, which reports
the variances of ˆ
β 0 , ˆ
β 1 , ˆ
β 2 and ˆ
β 3 , that are obtained from the positive square root of
diagonal elements of estimated covariance matrix V ( ˆ
β)
= ˆ
σ
2
(X
T X )
−1 , where ˆ
σ
2
=
(y−X ˆ
β)
T (y−X ˆ
β)
n−(k+1)
=
y
T [I −X (X
T X )
−1 X
T ]y
n−(k+1)
with n = 10 and k = 3. Also, the value given by
Residual standard error: 1.138 provides the value of
√ ˆ
σ 2 = 1.138.
Test of hypothesis:
The fourth column under the Coefficients is t value, which gives the values
of t =
ˆ
β j
√ ˆ
σ 2 C j j
to test the null hypothesis about individual regression coefficients
H 0 : β j = 0,( j = 0, 1, 2, 3) versus the alternative hypothesis H 1 : β j = 0.
Let the chosen level of significance is at 5%, i.e., α = 0.05. The fifth column
under the Coefficients is Pr(>|t|), which gives the p-values corresponding
to H 0 : β j = 0. For example, the t values for H 0 : β 0 = 0 (for intercept) is
3.511, and its corresponding p-value is 0.012654, which is less than the level of
significance α = 0.05. This indicates that H 0 : β 0 = 0 is rejected. Similarly, the
t values for H 0 : β 1 = 0 (windspeed) is 7.001, and its corresponding p-value
is 0.000423, which is less than the level of significance α = 0.05. This indicates
that H 0 : β 1 = 0 is rejected meaning thereby that the variable “windspeed” is an
important variable and is contributing in explaining the variation in “rainfall”. The
t values for H 0 : β 2 = 0 (precipitation) and H 0 : β 3 = 0 (relative
humidity) are 4.395 and 18.334, respectively, and the corresponding p values are
0.004592 and 1.7 × 10
−06 , respectively, which are less than the level of significance
α = 0.05 indicating that the variables “precipitation” and “relative humidity” are
relevant variables. The following outcome
Signif. codes: 0 ‘***’ 0.001 ‘**’ 0.01 ‘*’ 0.05 ‘.’ 0.1 ‘ ’ 1
indicates various values of α = 0.001, α = 0.01, α = 0.05, α = 0.1, α = 1 and
stars (*) after the p-values indicate the outcome of test of hypothesis in terms of the
significance of H 0 : β j = 0.
Goodness of fit:
The second last line in the outcome is Multiple R-squared: 0.9865 and
Adjusted R-squared: 0.9797, which provides the values of coefficient of
determination R
2 in (19) and adjusted R
2 in (20), respectively. Thus R
2
= 0.9865
and ¯
R
2
= 0.9797 indicate that the fitted model is nearly 97–98% “good”.