

41
9 Grain Morphology and Texture
During transportation and deposition, the detrital quartz grains get imprints of the
processes acting on them. Scanning Electron Microscope (SEM) photographs were
used to study the grain morphology and textures to understand the sedimentary
processes involved. The samples were prepared as per the procedure described by
Krinsley and Doornkamp (1973). Thirty representative quartz-grains from five samples were picked up using binocular microscope and observed for grain morphology
and surface micro texture.
The SEM photographs of the samples collected from different glacial surfaces
ST-1 to ST-5 (Figs. 12, 13, 14, 15, 16, 17, 18, and 19) and one sample collected from
the vertical section at the base of Norite Hill (NH) are shown in Plates 8.
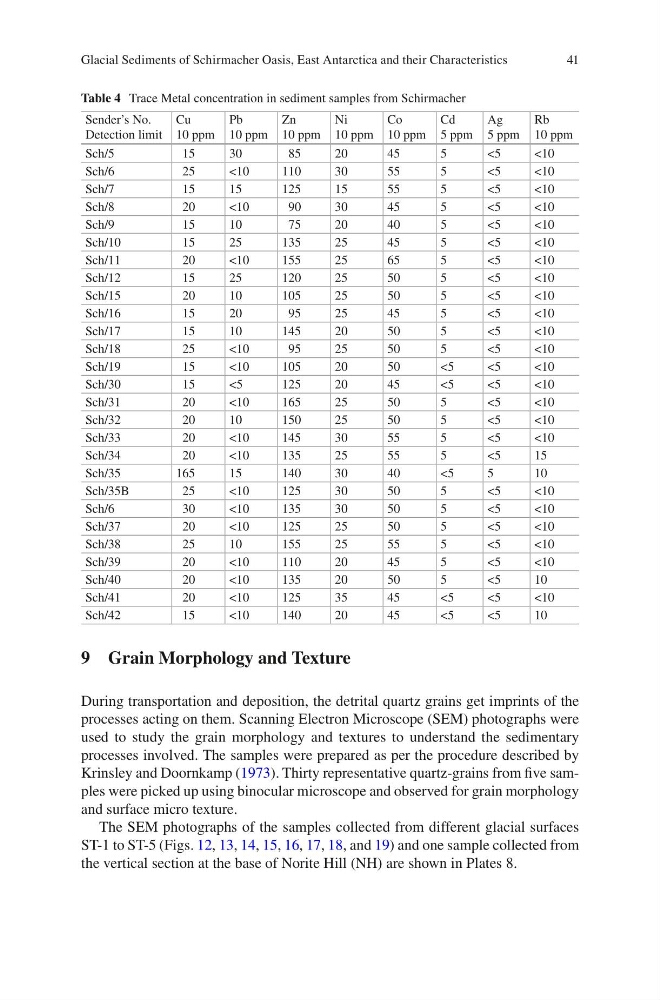
Table 4 Trace Metal concentration in sediment samples from Schirmacher
Sender’s No.
Detection limit
Cu
10 ppm
Pb
10 ppm
Zn
10 ppm
Ni
10 ppm
Co
10 ppm
Cd
5 ppm
Ag
5 ppm
Rb
10 ppm
Sch/5
15
30
85
20
45
5
<5
<10
Sch/6
25
<10
110
30
55
5
<5
<10
Sch/7
15
15
125
15
55
5
<5
<10
Sch/8
20
<10
90
30
45
5
<5
<10
Sch/9
15
10
75
20
40
5
<5
<10
Sch/10
15
25
135
25
45
5
<5
<10
Sch/11
20
<10
155
25
65
5
<5
<10
Sch/12
15
25
120
25
50
5
<5
<10
Sch/15
20
10
105
25
50
5
<5
<10
Sch/16
15
20
95
25
45
5
<5
<10
Sch/17
15
10
145
20
50
5
<5
<10
Sch/18
25
<10
95
25
50
5
<5
<10
Sch/19
15
<10
105
20
50
<5
<5
<10
Sch/30
15
<5
125
20
45
<5
<5
<10
Sch/31
20
<10
165
25
50
5
<5
<10
Sch/32
20
10
150
25
50
5
<5
<10
Sch/33
20
<10
145
30
55
5
<5
<10
Sch/34
20
<10
135
25
55
5
<5
15
Sch/35
165
15
140
30
40
<5
5
10
Sch/35B
25
<10
125
30
50
5
<5
<10
Sch/6
30
<10
135
30
50
5
<5
<10
Sch/37
20
<10
125
25
50
5
<5
<10
Sch/38
25
10
155
25
55
5
<5
<10
Sch/39
20
<10
110
20
45
5
<5
<10
Sch/40
20
<10
135
20
50
5
<5
10
Sch/41
20
<10
125
35
45
<5
<5
<10
Sch/42
15
<10
140
20
45
<5
<5
10
Glacial Sediments of Schirmacher Oasis, East Antarctica and their Characteristics
9 Grain Morphology and Texture
During transportation and deposition, the detrital quartz grains get imprints of the
processes acting on them. Scanning Electron Microscope (SEM) photographs were
used to study the grain morphology and textures to understand the sedimentary
processes involved. The samples were prepared as per the procedure described by
Krinsley and Doornkamp (1973). Thirty representative quartz-grains from five samples were picked up using binocular microscope and observed for grain morphology
and surface micro texture.
The SEM photographs of the samples collected from different glacial surfaces
ST-1 to ST-5 (Figs. 12, 13, 14, 15, 16, 17, 18, and 19) and one sample collected from
the vertical section at the base of Norite Hill (NH) are shown in Plates 8.
Table 4 Trace Metal concentration in sediment samples from Schirmacher
Sender’s No.
Detection limit
Cu
10 ppm
Pb
10 ppm
Zn
10 ppm
Ni
10 ppm
Co
10 ppm
Cd
5 ppm
Ag
5 ppm
Rb
10 ppm
Sch/5
15
30
85
20
45
5
<5
<10
Sch/6
25
<10
110
30
55
5
<5
<10
Sch/7
15
15
125
15
55
5
<5
<10
Sch/8
20
<10
90
30
45
5
<5
<10
Sch/9
15
10
75
20
40
5
<5
<10
Sch/10
15
25
135
25
45
5
<5
<10
Sch/11
20
<10
155
25
65
5
<5
<10
Sch/12
15
25
120
25
50
5
<5
<10
Sch/15
20
10
105
25
50
5
<5
<10
Sch/16
15
20
95
25
45
5
<5
<10
Sch/17
15
10
145
20
50
5
<5
<10
Sch/18
25
<10
95
25
50
5
<5
<10
Sch/19
15
<10
105
20
50
<5
<5
<10
Sch/30
15
<5
125
20
45
<5
<5
<10
Sch/31
20
<10
165
25
50
5
<5
<10
Sch/32
20
10
150
25
50
5
<5
<10
Sch/33
20
<10
145
30
55
5
<5
<10
Sch/34
20
<10
135
25
55
5
<5
15
Sch/35
165
15
140
30
40
<5
5
10
Sch/35B
25
<10
125
30
50
5
<5
<10
Sch/6
30
<10
135
30
50
5
<5
<10
Sch/37
20
<10
125
25
50
5
<5
<10
Sch/38
25
10
155
25
55
5
<5
<10
Sch/39
20
<10
110
20
45
5
<5
<10
Sch/40
20
<10
135
20
50
5
<5
10
Sch/41
20
<10
125
35
45
<5
<5
<10
Sch/42
15
<10
140
20
45
<5
<5
10
Glacial Sediments of Schirmacher Oasis, East Antarctica and their Characteristics