

16
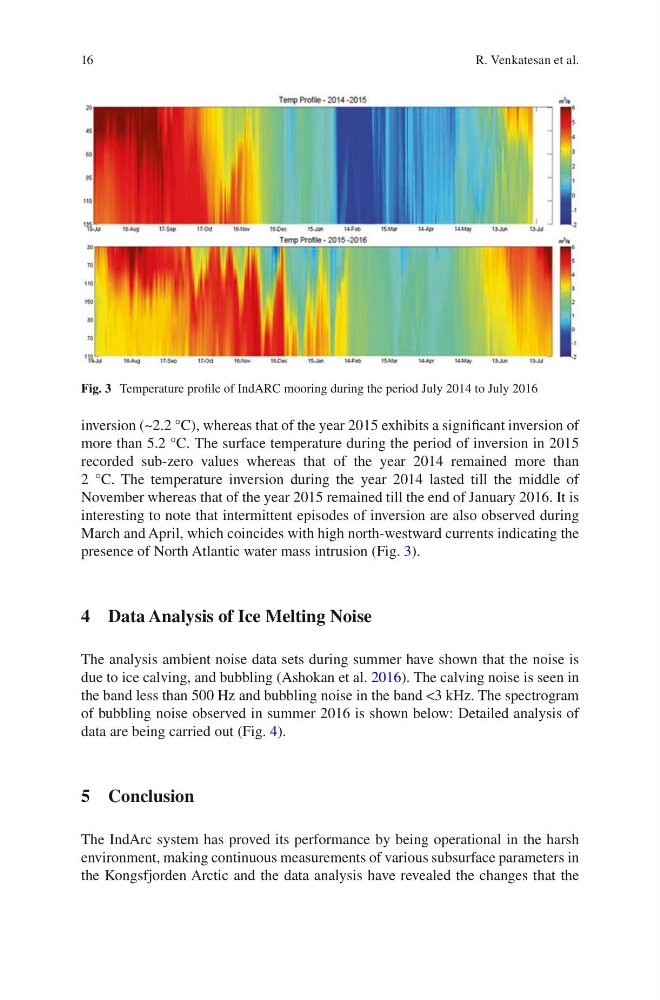
inversion (~2.2 °C), whereas that of the year 2015 exhibits a significant inversion of
more than 5.2 °C. The surface temperature during the period of inversion in 2015
recorded sub-zero values whereas that of the year 2014 remained more than
2 °C. The temperature inversion during the year 2014 lasted till the middle of
November whereas that of the year 2015 remained till the end of January 2016. It is
interesting to note that intermittent episodes of inversion are also observed during
March and April, which coincides with high north-westward currents indicating the
presence of North Atlantic water mass intrusion (Fig. 3).
4 Data Analysis of Ice Melting Noise
The analysis ambient noise data sets during summer have shown that the noise is
due to ice calving, and bubbling (Ashokan et al. 2016). The calving noise is seen in
the band less than 500 Hz and bubbling noise in the band <3 kHz. The spectrogram
of bubbling noise observed in summer 2016 is shown below: Detailed analysis of
data are being carried out (Fig. 4).
5 Conclusion
The IndArc system has proved its performance by being operational in the harsh
environment, making continuous measurements of various subsurface parameters in
the Kongsfjorden Arctic and the data analysis have revealed the changes that the
Fig. 3 Temperature profile of IndARC mooring during the period July 2014 to July 2016
R. Venkatesan et al.
inversion (~2.2 °C), whereas that of the year 2015 exhibits a significant inversion of
more than 5.2 °C. The surface temperature during the period of inversion in 2015
recorded sub-zero values whereas that of the year 2014 remained more than
2 °C. The temperature inversion during the year 2014 lasted till the middle of
November whereas that of the year 2015 remained till the end of January 2016. It is
interesting to note that intermittent episodes of inversion are also observed during
March and April, which coincides with high north-westward currents indicating the
presence of North Atlantic water mass intrusion (Fig. 3).
4 Data Analysis of Ice Melting Noise
The analysis ambient noise data sets during summer have shown that the noise is
due to ice calving, and bubbling (Ashokan et al. 2016). The calving noise is seen in
the band less than 500 Hz and bubbling noise in the band <3 kHz. The spectrogram
of bubbling noise observed in summer 2016 is shown below: Detailed analysis of
data are being carried out (Fig. 4).
5 Conclusion
The IndArc system has proved its performance by being operational in the harsh
environment, making continuous measurements of various subsurface parameters in
the Kongsfjorden Arctic and the data analysis have revealed the changes that the
Fig. 3 Temperature profile of IndARC mooring during the period July 2014 to July 2016
R. Venkatesan et al.