

185
highest and lowest average daily discharge of 0.25 × 10
6
m
3
and 0.20 × 10
6
m
3
were
recorded in 2003 and 2002, respectively.
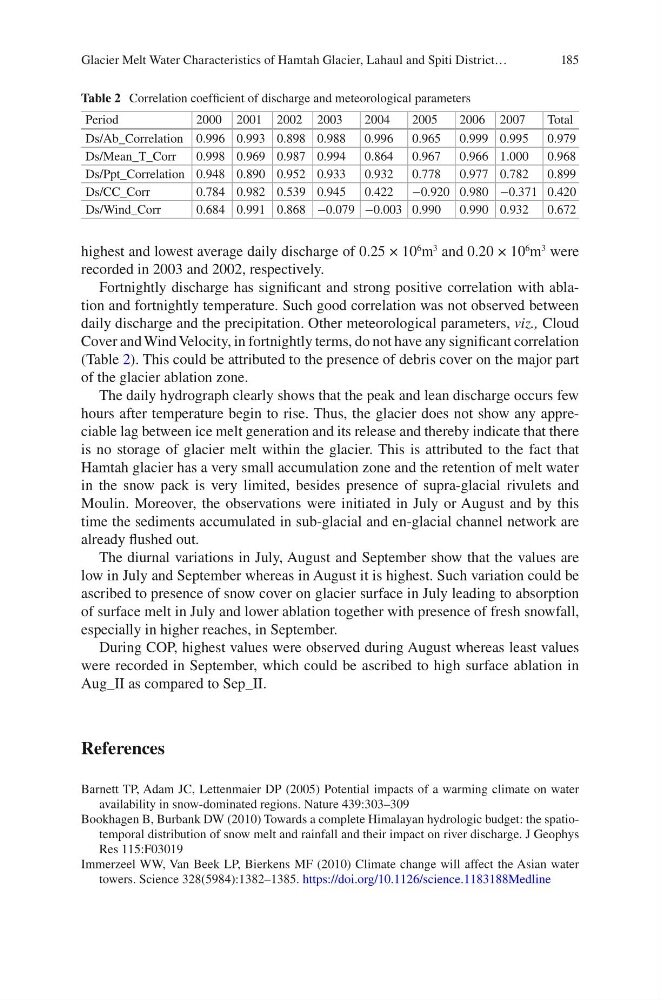
Fortnightly discharge has significant and strong positive correlation with ablation and fortnightly temperature. Such good correlation was not observed between
daily discharge and the precipitation. Other meteorological parameters, viz., Cloud
Cover and Wind Velocity, in fortnightly terms, do not have any significant correlation
(Table 2). This could be attributed to the presence of debris cover on the major part
of the glacier ablation zone.
The daily hydrograph clearly shows that the peak and lean discharge occurs few
hours after temperature begin to rise. Thus, the glacier does not show any appreciable lag between ice melt generation and its release and thereby indicate that there
is no storage of glacier melt within the glacier. This is attributed to the fact that
Hamtah glacier has a very small accumulation zone and the retention of melt water
in the snow pack is very limited, besides presence of supra-glacial rivulets and
Moulin. Moreover, the observations were initiated in July or August and by this
time the sediments accumulated in sub-glacial and en-glacial channel network are
already flushed out.
The diurnal variations in July, August and September show that the values are
low in July and September whereas in August it is highest. Such variation could be
ascribed to presence of snow cover on glacier surface in July leading to absorption
of surface melt in July and lower ablation together with presence of fresh snowfall,
especially in higher reaches, in September.
During COP, highest values were observed during August whereas least values
were recorded in September, which could be ascribed to high surface ablation in
Aug_II as compared to Sep_II.
References
Barnett TP, Adam JC, Lettenmaier DP (2005) Potential impacts of a warming climate on water
availability in snow-dominated regions. Nature 439:303–309
Bookhagen B, Burbank DW (2010) Towards a complete Himalayan hydrologic budget: the spatiotemporal distribution of snow melt and rainfall and their impact on river discharge. J Geophys
Res 115:F03019
Immerzeel WW, Van Beek LP, Bierkens MF (2010) Climate change will affect the Asian water
towers. Science 328(5984):1382–1385. https://doi.org/10.1126/science.1183188Medline
Table 2 Correlation coefficient of discharge and meteorological parameters
Period
2000 2001 2002 2003
2004
2005
2006 2007
Total
Ds/Ab_Correlation 0.996 0.993 0.898 0.988 0.996 0.965 0.999 0.995 0.979
Ds/Mean_T_Corr
0.998 0.969 0.987 0.994 0.864 0.967 0.966 1.000 0.968
Ds/Ppt_Correlation 0.948 0.890 0.952 0.933 0.932 0.778 0.977 0.782 0.899
Ds/CC_Corr
0.784 0.982 0.539 0.945 0.422 −0.920 0.980 −0.371 0.420
Ds/Wind_Corr
0.684 0.991 0.868 −0.079 −0.003 0.990 0.990 0.932 0.672
Glacier Melt Water Characteristics of Hamtah Glacier, Lahaul and Spiti District…
highest and lowest average daily discharge of 0.25 × 10
6
m
3
and 0.20 × 10
6
m
3
were
recorded in 2003 and 2002, respectively.
Fortnightly discharge has significant and strong positive correlation with ablation and fortnightly temperature. Such good correlation was not observed between
daily discharge and the precipitation. Other meteorological parameters, viz., Cloud
Cover and Wind Velocity, in fortnightly terms, do not have any significant correlation
(Table 2). This could be attributed to the presence of debris cover on the major part
of the glacier ablation zone.
The daily hydrograph clearly shows that the peak and lean discharge occurs few
hours after temperature begin to rise. Thus, the glacier does not show any appreciable lag between ice melt generation and its release and thereby indicate that there
is no storage of glacier melt within the glacier. This is attributed to the fact that
Hamtah glacier has a very small accumulation zone and the retention of melt water
in the snow pack is very limited, besides presence of supra-glacial rivulets and
Moulin. Moreover, the observations were initiated in July or August and by this
time the sediments accumulated in sub-glacial and en-glacial channel network are
already flushed out.
The diurnal variations in July, August and September show that the values are
low in July and September whereas in August it is highest. Such variation could be
ascribed to presence of snow cover on glacier surface in July leading to absorption
of surface melt in July and lower ablation together with presence of fresh snowfall,
especially in higher reaches, in September.
During COP, highest values were observed during August whereas least values
were recorded in September, which could be ascribed to high surface ablation in
Aug_II as compared to Sep_II.
References
Barnett TP, Adam JC, Lettenmaier DP (2005) Potential impacts of a warming climate on water
availability in snow-dominated regions. Nature 439:303–309
Bookhagen B, Burbank DW (2010) Towards a complete Himalayan hydrologic budget: the spatiotemporal distribution of snow melt and rainfall and their impact on river discharge. J Geophys
Res 115:F03019
Immerzeel WW, Van Beek LP, Bierkens MF (2010) Climate change will affect the Asian water
towers. Science 328(5984):1382–1385. https://doi.org/10.1126/science.1183188Medline
Table 2 Correlation coefficient of discharge and meteorological parameters
Period
2000 2001 2002 2003
2004
2005
2006 2007
Total
Ds/Ab_Correlation 0.996 0.993 0.898 0.988 0.996 0.965 0.999 0.995 0.979
Ds/Mean_T_Corr
0.998 0.969 0.987 0.994 0.864 0.967 0.966 1.000 0.968
Ds/Ppt_Correlation 0.948 0.890 0.952 0.933 0.932 0.778 0.977 0.782 0.899
Ds/CC_Corr
0.784 0.982 0.539 0.945 0.422 −0.920 0.980 −0.371 0.420
Ds/Wind_Corr
0.684 0.991 0.868 −0.079 −0.003 0.990 0.990 0.932 0.672
Glacier Melt Water Characteristics of Hamtah Glacier, Lahaul and Spiti District…