

179
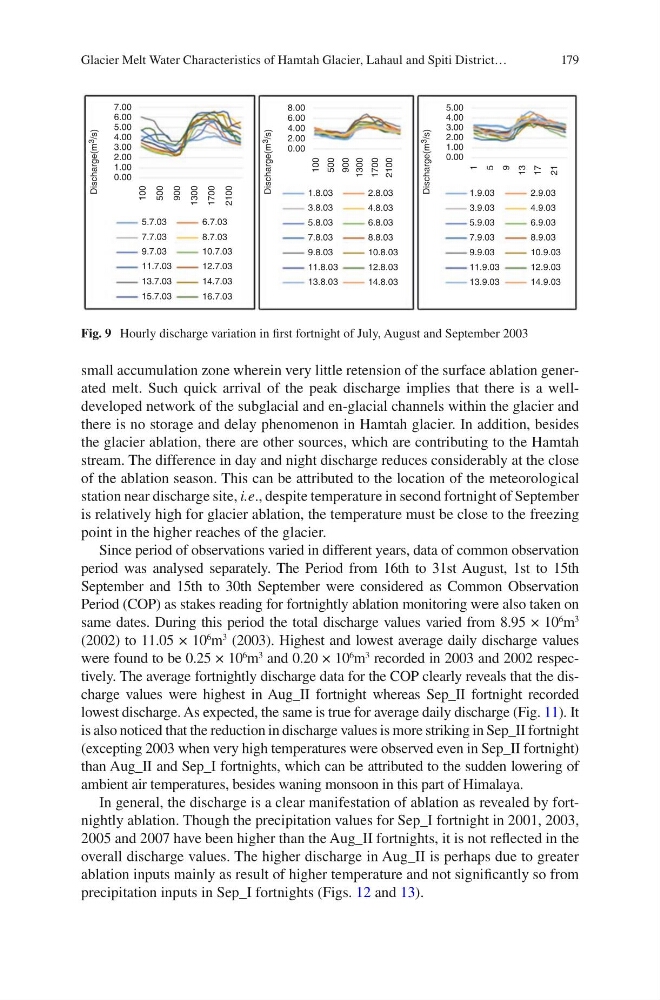
small accumulation zone wherein very little retension of the surface ablation generated melt. Such quick arrival of the peak discharge implies that there is a welldeveloped network of the subglacial and en-glacial channels within the glacier and
there is no storage and delay phenomenon in Hamtah glacier. In addition, besides
the glacier ablation, there are other sources, which are contributing to the Hamtah
stream. The difference in day and night discharge reduces considerably at the close
of the ablation season. This can be attributed to the location of the meteorological
station near discharge site, i.e., despite temperature in second fortnight of September
is relatively high for glacier ablation, the temperature must be close to the freezing
point in the higher reaches of the glacier.
Since period of observations varied in different years, data of common observation
period was analysed separately. The Period from 16th to 31st August, 1st to 15th
September and 15th to 30th September were considered as Common Observation
Period (COP) as stakes reading for fortnightly ablation monitoring were also taken on
same dates. During this period the total discharge values varied from 8.95 × 10
6
m
3
(2002) to 11.05 × 10
6
m
3
(2003). Highest and lowest average daily discharge values
were found to be 0.25 × 10
6
m
3
and 0.20 × 10
6
m
3
recorded in 2003 and 2002 respectively. The average fortnightly discharge data for the COP clearly reveals that the discharge values were highest in Aug_II fortnight whereas Sep_II fortnight recorded
lowest discharge. As expected, the same is true for average daily discharge (Fig. 11). It
is also noticed that the reduction in discharge values is more striking in Sep_II fortnight
(excepting 2003 when very high temperatures were observed even in Sep_II fortnight)
than Aug_II and Sep_I fortnights, which can be attributed to the sudden lowering of
ambient air temperatures, besides waning monsoon in this part of Himalaya.
In general, the discharge is a clear manifestation of ablation as revealed by fortnightly ablation. Though the precipitation values for Sep_I fortnight in 2001, 2003,
2005 and 2007 have been higher than the Aug_II fortnights, it is not reflected in the
overall discharge values. The higher discharge in Aug_II is perhaps due to greater
ablation inputs mainly as result of higher temperature and not significantly so from
precipitation inputs in Sep_I fortnights (Figs. 12 and 13).
7.00
8.00
6.00
4.00
2.00
0.00
6.00
5.00
4.00
3.00
2.00
1.00
0.00
5.7.03
7.7.03
9.7.03
11.7.03
13.7.03
15.7.03
6.7.03
1.8.03
3.8.03
5.8.03
7.8.03
9.8.03
11.8.03
13.8.03
1.9.03
3.9.03
5.9.03
7.9.03
9.9.03
11.9.03
13.9.03
2.8.03
4.8.03
6.8.03
8.8.03
10.8.03
12.8.03
14.8.03
2.9.03
4.9.03
6.9.03
8.9.03
10.9.03
12.9.03
14.9.03
8.7.03
10.7.03
12.7.03
14.7.03
16.7.03
100
Discharge(m 3
/s)
Discharge(m 3
/s)
Discharge(m 3
/s)
500
900
1300
1700
2100
100
1
5
9
13
17
21
500
900
1300
1700
2100
5.00
4.00
3.00
2.00
1.00
0.00
Fig. 9 Hourly discharge variation in first fortnight of July, August and September 2003
Glacier Melt Water Characteristics of Hamtah Glacier, Lahaul and Spiti District…
small accumulation zone wherein very little retension of the surface ablation generated melt. Such quick arrival of the peak discharge implies that there is a welldeveloped network of the subglacial and en-glacial channels within the glacier and
there is no storage and delay phenomenon in Hamtah glacier. In addition, besides
the glacier ablation, there are other sources, which are contributing to the Hamtah
stream. The difference in day and night discharge reduces considerably at the close
of the ablation season. This can be attributed to the location of the meteorological
station near discharge site, i.e., despite temperature in second fortnight of September
is relatively high for glacier ablation, the temperature must be close to the freezing
point in the higher reaches of the glacier.
Since period of observations varied in different years, data of common observation
period was analysed separately. The Period from 16th to 31st August, 1st to 15th
September and 15th to 30th September were considered as Common Observation
Period (COP) as stakes reading for fortnightly ablation monitoring were also taken on
same dates. During this period the total discharge values varied from 8.95 × 10
6
m
3
(2002) to 11.05 × 10
6
m
3
(2003). Highest and lowest average daily discharge values
were found to be 0.25 × 10
6
m
3
and 0.20 × 10
6
m
3
recorded in 2003 and 2002 respectively. The average fortnightly discharge data for the COP clearly reveals that the discharge values were highest in Aug_II fortnight whereas Sep_II fortnight recorded
lowest discharge. As expected, the same is true for average daily discharge (Fig. 11). It
is also noticed that the reduction in discharge values is more striking in Sep_II fortnight
(excepting 2003 when very high temperatures were observed even in Sep_II fortnight)
than Aug_II and Sep_I fortnights, which can be attributed to the sudden lowering of
ambient air temperatures, besides waning monsoon in this part of Himalaya.
In general, the discharge is a clear manifestation of ablation as revealed by fortnightly ablation. Though the precipitation values for Sep_I fortnight in 2001, 2003,
2005 and 2007 have been higher than the Aug_II fortnights, it is not reflected in the
overall discharge values. The higher discharge in Aug_II is perhaps due to greater
ablation inputs mainly as result of higher temperature and not significantly so from
precipitation inputs in Sep_I fortnights (Figs. 12 and 13).
7.00
8.00
6.00
4.00
2.00
0.00
6.00
5.00
4.00
3.00
2.00
1.00
0.00
5.7.03
7.7.03
9.7.03
11.7.03
13.7.03
15.7.03
6.7.03
1.8.03
3.8.03
5.8.03
7.8.03
9.8.03
11.8.03
13.8.03
1.9.03
3.9.03
5.9.03
7.9.03
9.9.03
11.9.03
13.9.03
2.8.03
4.8.03
6.8.03
8.8.03
10.8.03
12.8.03
14.8.03
2.9.03
4.9.03
6.9.03
8.9.03
10.9.03
12.9.03
14.9.03
8.7.03
10.7.03
12.7.03
14.7.03
16.7.03
100
Discharge(m 3
/s)
Discharge(m 3
/s)
Discharge(m 3
/s)
500
900
1300
1700
2100
100
1
5
9
13
17
21
500
900
1300
1700
2100
5.00
4.00
3.00
2.00
1.00
0.00
Fig. 9 Hourly discharge variation in first fortnight of July, August and September 2003
Glacier Melt Water Characteristics of Hamtah Glacier, Lahaul and Spiti District…