

175
tion using standard techniques. Meteorological data thus collected was processed,
analysed and correlated with discharge parameters to understand the effect of these
parameters on discharge generation.
3.3 Ablation Measurement
Since the glacier has also been under observation for mass balance estimation, the
stake network available on the glacier was utilized for fortnightly ablation computation. For this purpose, stakes were monitored on 1st July, 16th July, 31st July, 16th
August, 31st August, 15th September and 30th September every year. Correlation of
the fortnightly ablation data with the fortnightly discharge was undertaken.
4 Discussion
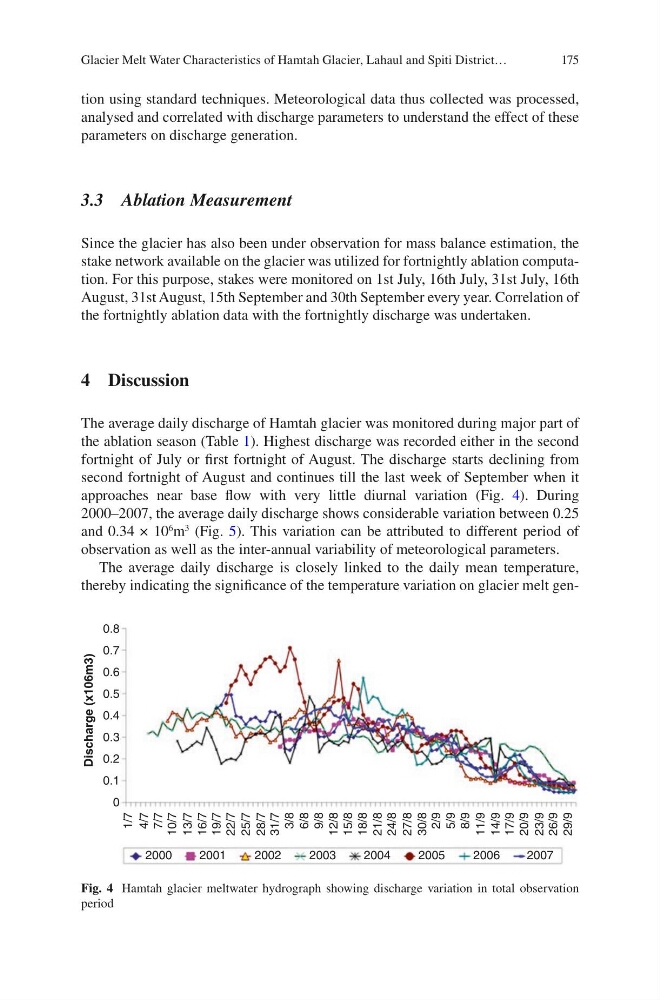
The average daily discharge of Hamtah glacier was monitored during major part of
the ablation season (Table 1). Highest discharge was recorded either in the second
fortnight of July or first fortnight of August. The discharge starts declining from
second fortnight of August and continues till the last week of September when it
approaches near base flow with very little diurnal variation (Fig. 4). During
2000–2007, the average daily discharge shows considerable variation between 0.25
and 0.34 × 10
6
m
3
(Fig. 5). This variation can be attributed to different period of
observation as well as the inter-annual variability of meteorological parameters.
The average daily discharge is closely linked to the daily mean temperature,
thereby indicating the significance of the temperature variation on glacier melt gen0.8
0.7
0.6
0.5
0.4
0.3
0.2
0.1
0
Discharge (x106m3)
2000
2001
2002
2003
2004
2005
2006
2007
1/7
4/7
7/7
10/7
13/7
16/7
19/7
22/7
25/7
28/7
31/7
3/8
9/8
6/8
12/8
15/8
18/8
21/8
24/8
27/8
30/8
2/9
5/9
8/9
11/9
14/9
17/9
20/9
23/9
26/9
29/9
Fig. 4 Hamtah glacier meltwater hydrograph showing discharge variation in total observation
period
Glacier Melt Water Characteristics of Hamtah Glacier, Lahaul and Spiti District…
tion using standard techniques. Meteorological data thus collected was processed,
analysed and correlated with discharge parameters to understand the effect of these
parameters on discharge generation.
3.3 Ablation Measurement
Since the glacier has also been under observation for mass balance estimation, the
stake network available on the glacier was utilized for fortnightly ablation computation. For this purpose, stakes were monitored on 1st July, 16th July, 31st July, 16th
August, 31st August, 15th September and 30th September every year. Correlation of
the fortnightly ablation data with the fortnightly discharge was undertaken.
4 Discussion
The average daily discharge of Hamtah glacier was monitored during major part of
the ablation season (Table 1). Highest discharge was recorded either in the second
fortnight of July or first fortnight of August. The discharge starts declining from
second fortnight of August and continues till the last week of September when it
approaches near base flow with very little diurnal variation (Fig. 4). During
2000–2007, the average daily discharge shows considerable variation between 0.25
and 0.34 × 10
6
m
3
(Fig. 5). This variation can be attributed to different period of
observation as well as the inter-annual variability of meteorological parameters.
The average daily discharge is closely linked to the daily mean temperature,
thereby indicating the significance of the temperature variation on glacier melt gen0.8
0.7
0.6
0.5
0.4
0.3
0.2
0.1
0
Discharge (x106m3)
2000
2001
2002
2003
2004
2005
2006
2007
1/7
4/7
7/7
10/7
13/7
16/7
19/7
22/7
25/7
28/7
31/7
3/8
9/8
6/8
12/8
15/8
18/8
21/8
24/8
27/8
30/8
2/9
5/9
8/9
11/9
14/9
17/9
20/9
23/9
26/9
29/9
Fig. 4 Hamtah glacier meltwater hydrograph showing discharge variation in total observation
period
Glacier Melt Water Characteristics of Hamtah Glacier, Lahaul and Spiti District…