

174
Q A Vm
= ×
Q = Discharge
A = Area
Vm = surface velocity × constant d
Round the clock hourly monitoring of stream gauge and subsequent computation
of the hourly discharges was done through the rating curve. The hourly gauge
heights were transformed to corresponding water discharge values, in m
3
/sec, from
the rating curves, and daily discharge flows were computed. The rating observations
were repeated for changes in channel configuration and higher or lower discharges.
Preventive measures were adopted to avoid possibility of any scouring/filling or
backwaters, at the stream gauge. Discharge measurement period varied in different
years due to accessibility and technical feasibility. Table 1 gives the period of observation in different years.
3.2 Meteorological Data Collection
Meteorological data including maximum and minimum temperature, precipitation,
relative humidity, cloud cover and wind speed were collected four times daily, viz.,
0830, 1130, 1430 and 1730 h at a manual observatory established at about 750 m
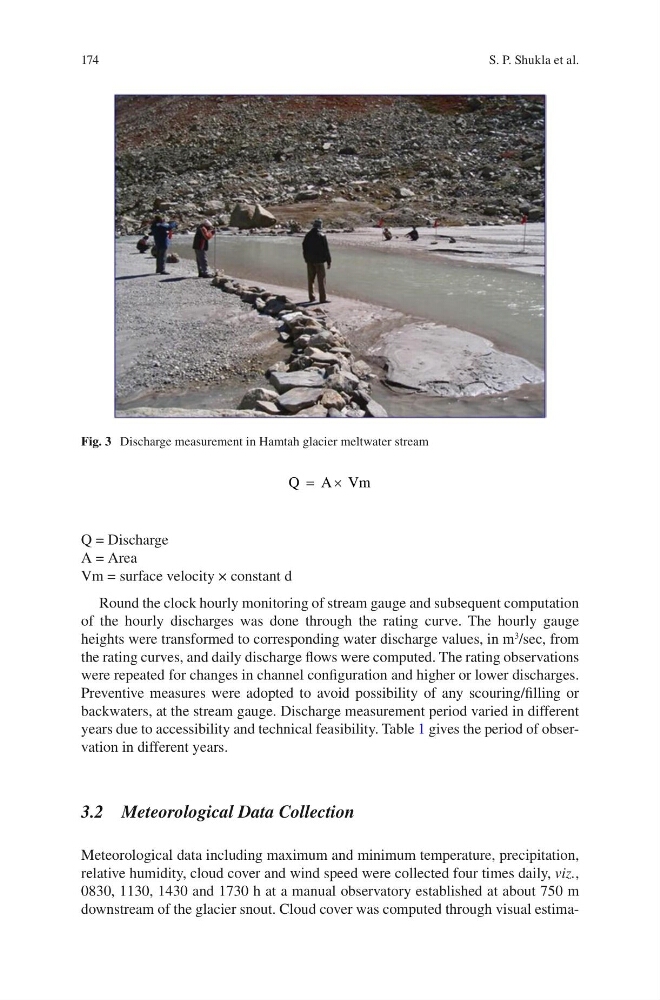
downstream of the glacier snout. Cloud cover was computed through visual estimaFig. 3 Discharge measurement in Hamtah glacier meltwater stream
S. P. Shukla et al.
Q A Vm
= ×
Q = Discharge
A = Area
Vm = surface velocity × constant d
Round the clock hourly monitoring of stream gauge and subsequent computation
of the hourly discharges was done through the rating curve. The hourly gauge
heights were transformed to corresponding water discharge values, in m
3
/sec, from
the rating curves, and daily discharge flows were computed. The rating observations
were repeated for changes in channel configuration and higher or lower discharges.
Preventive measures were adopted to avoid possibility of any scouring/filling or
backwaters, at the stream gauge. Discharge measurement period varied in different
years due to accessibility and technical feasibility. Table 1 gives the period of observation in different years.
3.2 Meteorological Data Collection
Meteorological data including maximum and minimum temperature, precipitation,
relative humidity, cloud cover and wind speed were collected four times daily, viz.,
0830, 1130, 1430 and 1730 h at a manual observatory established at about 750 m
downstream of the glacier snout. Cloud cover was computed through visual estimaFig. 3 Discharge measurement in Hamtah glacier meltwater stream
S. P. Shukla et al.