

130
is located towards the western part of the study area, while a large area with such ice
thickness is located towards the south central part of the study area, where the ice
thickness increases further towards south with a range of 103–119 m. Towards south
and south-western part of the study area, the highest ice thickness is observed in
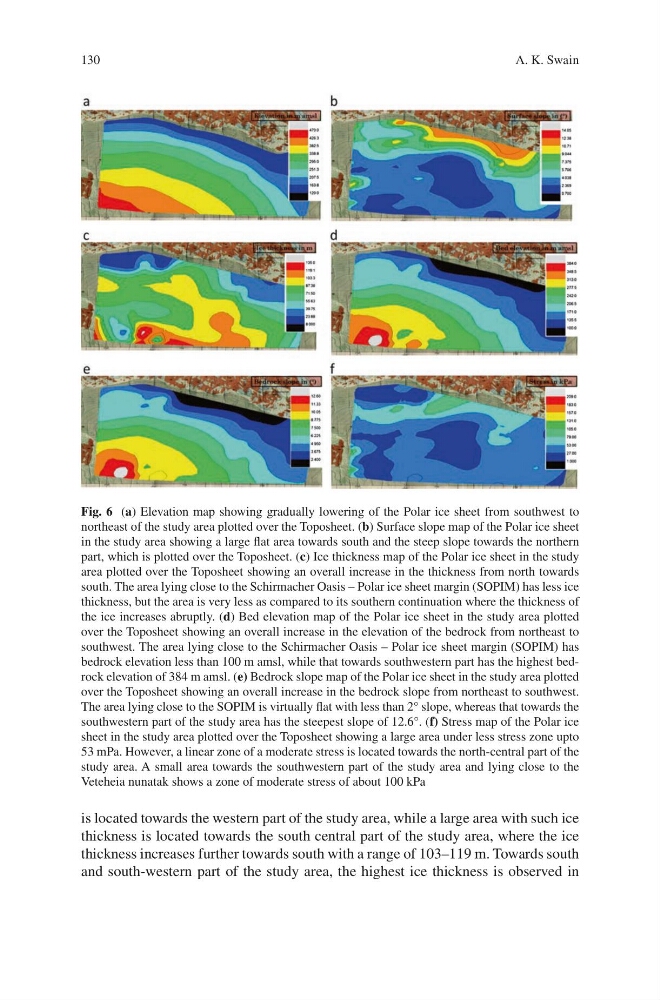
Fig. 6 (a) Elevation map showing gradually lowering of the Polar ice sheet from southwest to
northeast of the study area plotted over the Toposheet. (b) Surface slope map of the Polar ice sheet
in the study area showing a large flat area towards south and the steep slope towards the northern
part, which is plotted over the Toposheet. (c) Ice thickness map of the Polar ice sheet in the study
area plotted over the Toposheet showing an overall increase in the thickness from north towards
south. The area lying close to the Schirmacher Oasis – Polar ice sheet margin (SOPIM) has less ice
thickness, but the area is very less as compared to its southern continuation where the thickness of
the ice increases abruptly. (d) Bed elevation map of the Polar ice sheet in the study area plotted
over the Toposheet showing an overall increase in the elevation of the bedrock from northeast to
southwest. The area lying close to the Schirmacher Oasis – Polar ice sheet margin (SOPIM) has
bedrock elevation less than 100 m amsl, while that towards southwestern part has the highest bedrock elevation of 384 m amsl. (e) Bedrock slope map of the Polar ice sheet in the study area plotted
over the Toposheet showing an overall increase in the bedrock slope from northeast to southwest.
The area lying close to the SOPIM is virtually flat with less than 2° slope, whereas that towards the
southwestern part of the study area has the steepest slope of 12.6°. (f) Stress map of the Polar ice
sheet in the study area plotted over the Toposheet showing a large area under less stress zone upto
53 mPa. However, a linear zone of a moderate stress is located towards the north-central part of the
study area. A small area towards the southwestern part of the study area and lying close to the
Veteheia nunatak shows a zone of moderate stress of about 100 kPa
A. K. Swain
is located towards the western part of the study area, while a large area with such ice
thickness is located towards the south central part of the study area, where the ice
thickness increases further towards south with a range of 103–119 m. Towards south
and south-western part of the study area, the highest ice thickness is observed in
Fig. 6 (a) Elevation map showing gradually lowering of the Polar ice sheet from southwest to
northeast of the study area plotted over the Toposheet. (b) Surface slope map of the Polar ice sheet
in the study area showing a large flat area towards south and the steep slope towards the northern
part, which is plotted over the Toposheet. (c) Ice thickness map of the Polar ice sheet in the study
area plotted over the Toposheet showing an overall increase in the thickness from north towards
south. The area lying close to the Schirmacher Oasis – Polar ice sheet margin (SOPIM) has less ice
thickness, but the area is very less as compared to its southern continuation where the thickness of
the ice increases abruptly. (d) Bed elevation map of the Polar ice sheet in the study area plotted
over the Toposheet showing an overall increase in the elevation of the bedrock from northeast to
southwest. The area lying close to the Schirmacher Oasis – Polar ice sheet margin (SOPIM) has
bedrock elevation less than 100 m amsl, while that towards southwestern part has the highest bedrock elevation of 384 m amsl. (e) Bedrock slope map of the Polar ice sheet in the study area plotted
over the Toposheet showing an overall increase in the bedrock slope from northeast to southwest.
The area lying close to the SOPIM is virtually flat with less than 2° slope, whereas that towards the
southwestern part of the study area has the steepest slope of 12.6°. (f) Stress map of the Polar ice
sheet in the study area plotted over the Toposheet showing a large area under less stress zone upto
53 mPa. However, a linear zone of a moderate stress is located towards the north-central part of the
study area. A small area towards the southwestern part of the study area and lying close to the
Veteheia nunatak shows a zone of moderate stress of about 100 kPa
A. K. Swain