

129
4.2 Surface Slope
In spite of having a gradual rise in the elevation towards south and southwest, the
surface slope is not uniform throughout the study area (Fig. 6b). The surface slope
shows a large flat region towards the southern part, while towards the northern part,
close to the SOPIM, it is steep. Most of the parts close to the SOPIM have a slope
in the range of 10–12°. There is a long zone showing a glacial wall like feature
observed south of Maitri station, where the ice thickness is measured to be in the
range of 15–20 m. However the steepness of the ice surface slope gradually becomes
flat towards south and southwest. The south-western part of the study area lying
close to the Veteheia nunatak shows a rise in the surface slope.
4.3 Ice Thickness
Ice thickness is estimated from the GPR data, collected over the Polar ice sheet in
the study area. The ice thickness is less towards the SOPIM, lying towards the
northern part of the study area. The reduced ice thickness in the range of 8–23 m
towards the north-western part of the study area may be due to the presence of large
amount of snow that forms a ramp facilitating the vehicle movement from Maitri
station to the south. But the size of the area is less compared to its southern continuation where the thickness of the ice increases abruptly (Fig. 6c). Towards the central
part of the study area, a considerable area having an ice thickness in the range of
71–87 m is located. A small area with a thicker ice mass within a range of 87–103 m
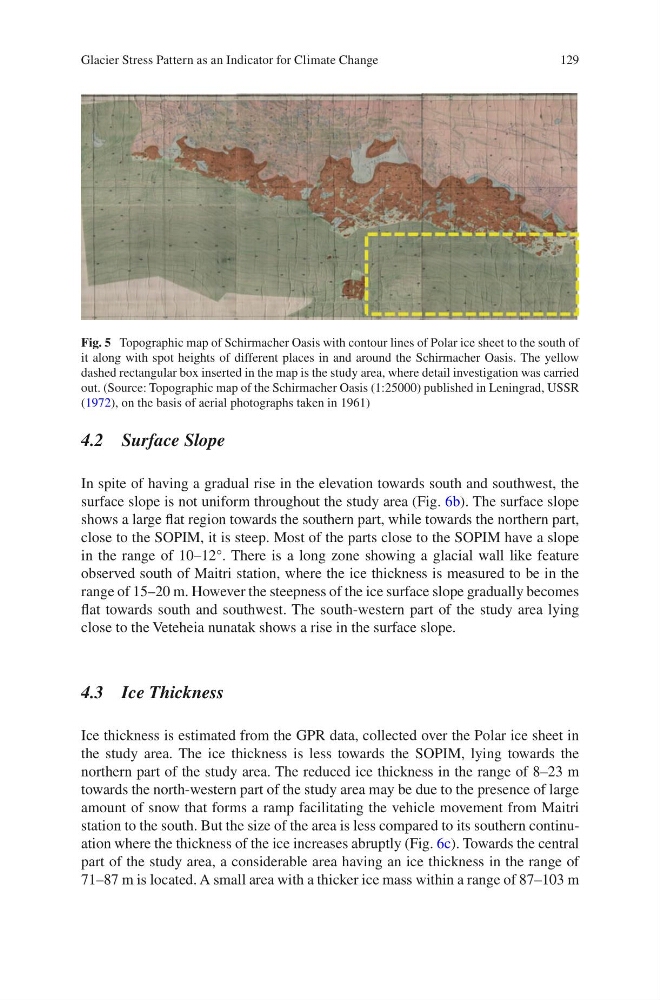
Fig. 5 Topographic map of Schirmacher Oasis with contour lines of Polar ice sheet to the south of
it along with spot heights of different places in and around the Schirmacher Oasis. The yellow
dashed rectangular box inserted in the map is the study area, where detail investigation was carried
out. (Source: Topographic map of the Schirmacher Oasis (1:25000) published in Leningrad, USSR
(1972), on the basis of aerial photographs taken in 1961)
Glacier Stress Pattern as an Indicator for Climate Change
4.2 Surface Slope
In spite of having a gradual rise in the elevation towards south and southwest, the
surface slope is not uniform throughout the study area (Fig. 6b). The surface slope
shows a large flat region towards the southern part, while towards the northern part,
close to the SOPIM, it is steep. Most of the parts close to the SOPIM have a slope
in the range of 10–12°. There is a long zone showing a glacial wall like feature
observed south of Maitri station, where the ice thickness is measured to be in the
range of 15–20 m. However the steepness of the ice surface slope gradually becomes
flat towards south and southwest. The south-western part of the study area lying
close to the Veteheia nunatak shows a rise in the surface slope.
4.3 Ice Thickness
Ice thickness is estimated from the GPR data, collected over the Polar ice sheet in
the study area. The ice thickness is less towards the SOPIM, lying towards the
northern part of the study area. The reduced ice thickness in the range of 8–23 m
towards the north-western part of the study area may be due to the presence of large
amount of snow that forms a ramp facilitating the vehicle movement from Maitri
station to the south. But the size of the area is less compared to its southern continuation where the thickness of the ice increases abruptly (Fig. 6c). Towards the central
part of the study area, a considerable area having an ice thickness in the range of
71–87 m is located. A small area with a thicker ice mass within a range of 87–103 m
Fig. 5 Topographic map of Schirmacher Oasis with contour lines of Polar ice sheet to the south of
it along with spot heights of different places in and around the Schirmacher Oasis. The yellow
dashed rectangular box inserted in the map is the study area, where detail investigation was carried
out. (Source: Topographic map of the Schirmacher Oasis (1:25000) published in Leningrad, USSR
(1972), on the basis of aerial photographs taken in 1961)
Glacier Stress Pattern as an Indicator for Climate Change