

115
precipitation data provided by the IMD. It can be seen from the diagram that the
precipitation maxima (4–5 mm/day) is seen over the Jammu and Kashmir region and
the precipitation amount reduces gradually southward. Over the region of interest, the
precipitation occurs due to frequent passages of WDs, and the rainfall variability is
coherent. Figure 9b, c shows the model simulated (GCM and RegCM4 respectively)
seasonal mean (DJF) precipitation climatology (mm/day) for the above mentioned
period. It is seen from Fig. 9b that the GCM (T80 model) is able to depict the observed
features of climatological precipitation up to certain extent spatially, however the
model underestimates the precipitation intensity by about 3 mm/day over most parts
of the region of interest. On the other hand a clear improvement in climatological
precipitation simulation can be seen in RegCM4 (Fig. 9c), however the precipitation
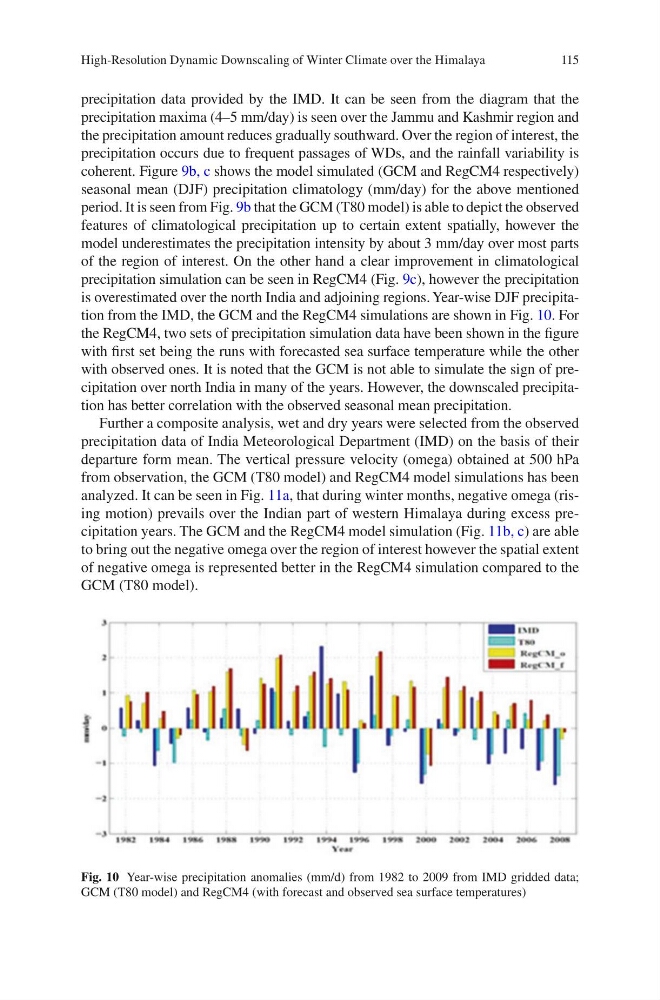
is overestimated over the north India and adjoining regions. Year-wise DJF precipitation from the IMD, the GCM and the RegCM4 simulations are shown in Fig. 10. For
the RegCM4, two sets of precipitation simulation data have been shown in the figure
with first set being the runs with forecasted sea surface temperature while the other
with observed ones. It is noted that the GCM is not able to simulate the sign of precipitation over north India in many of the years. However, the downscaled precipitation has better correlation with the observed seasonal mean precipitation.
Further a composite analysis, wet and dry years were selected from the observed
precipitation data of India Meteorological Department (IMD) on the basis of their
departure form mean. The vertical pressure velocity (omega) obtained at 500 hPa
from observation, the GCM (T80 model) and RegCM4 model simulations has been
analyzed. It can be seen in Fig. 11a, that during winter months, negative omega (rising motion) prevails over the Indian part of western Himalaya during excess precipitation years. The GCM and the RegCM4 model simulation (Fig. 11b, c) are able
to bring out the negative omega over the region of interest however the spatial extent
of negative omega is represented better in the RegCM4 simulation compared to the
GCM (T80 model).
Fig. 10 Year-wise precipitation anomalies (mm/d) from 1982 to 2009 from IMD gridded data;
GCM (T80 model) and RegCM4 (with forecast and observed sea surface temperatures)
High-Resolution Dynamic Downscaling of Winter Climate over the Himalaya
precipitation data provided by the IMD. It can be seen from the diagram that the
precipitation maxima (4–5 mm/day) is seen over the Jammu and Kashmir region and
the precipitation amount reduces gradually southward. Over the region of interest, the
precipitation occurs due to frequent passages of WDs, and the rainfall variability is
coherent. Figure 9b, c shows the model simulated (GCM and RegCM4 respectively)
seasonal mean (DJF) precipitation climatology (mm/day) for the above mentioned
period. It is seen from Fig. 9b that the GCM (T80 model) is able to depict the observed
features of climatological precipitation up to certain extent spatially, however the
model underestimates the precipitation intensity by about 3 mm/day over most parts
of the region of interest. On the other hand a clear improvement in climatological
precipitation simulation can be seen in RegCM4 (Fig. 9c), however the precipitation
is overestimated over the north India and adjoining regions. Year-wise DJF precipitation from the IMD, the GCM and the RegCM4 simulations are shown in Fig. 10. For
the RegCM4, two sets of precipitation simulation data have been shown in the figure
with first set being the runs with forecasted sea surface temperature while the other
with observed ones. It is noted that the GCM is not able to simulate the sign of precipitation over north India in many of the years. However, the downscaled precipitation has better correlation with the observed seasonal mean precipitation.
Further a composite analysis, wet and dry years were selected from the observed
precipitation data of India Meteorological Department (IMD) on the basis of their
departure form mean. The vertical pressure velocity (omega) obtained at 500 hPa
from observation, the GCM (T80 model) and RegCM4 model simulations has been
analyzed. It can be seen in Fig. 11a, that during winter months, negative omega (rising motion) prevails over the Indian part of western Himalaya during excess precipitation years. The GCM and the RegCM4 model simulation (Fig. 11b, c) are able
to bring out the negative omega over the region of interest however the spatial extent
of negative omega is represented better in the RegCM4 simulation compared to the
GCM (T80 model).
Fig. 10 Year-wise precipitation anomalies (mm/d) from 1982 to 2009 from IMD gridded data;
GCM (T80 model) and RegCM4 (with forecast and observed sea surface temperatures)
High-Resolution Dynamic Downscaling of Winter Climate over the Himalaya