

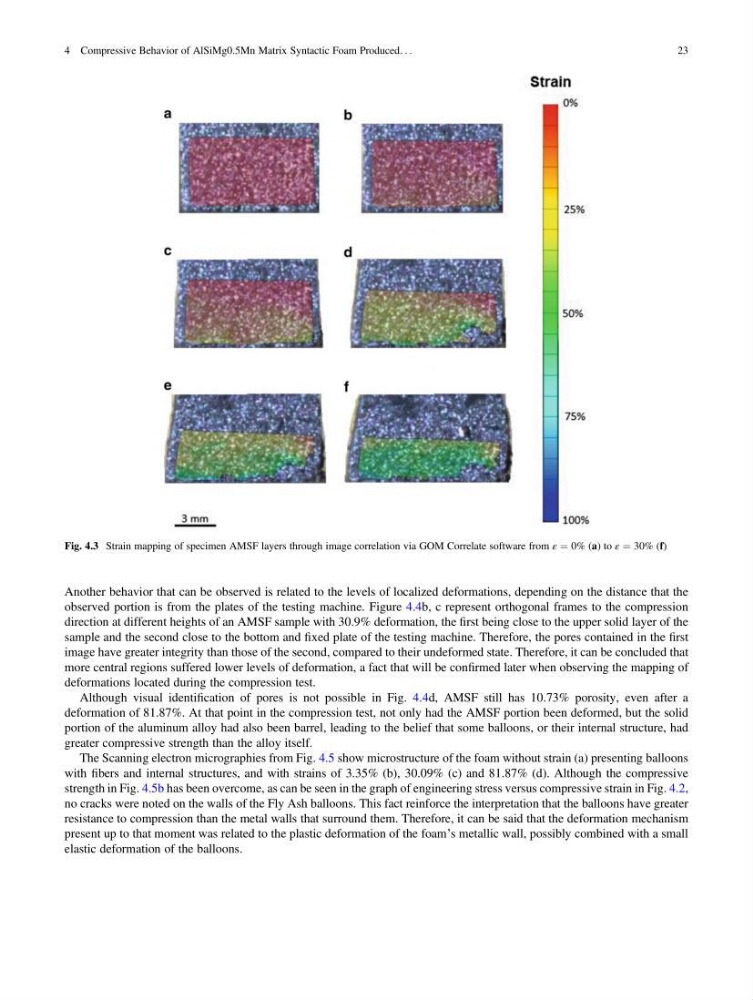
Another behavior that can be observed is related to the levels of localized deformations, depending on the distance that the
observed portion is from the plates of the testing machine. Figure 4.4b, c represent orthogonal frames to the compression
direction at different heights of an AMSF sample with 30.9% deformation, the first being close to the upper solid layer of the
sample and the second close to the bottom and fixed plate of the testing machine. Therefore, the pores contained in the first
image have greater integrity than those of the second, compared to their undeformed state. Therefore, it can be concluded that
more central regions suffered lower levels of deformation, a fact that will be confirmed later when observing the mapping of
deformations located during the compression test.
Although visual identification of pores is not possible in Fig. 4.4d, AMSF still has 10.73% porosity, even after a
deformation of 81.87%. At that point in the compression test, not only had the AMSF portion been deformed, but the solid
portion of the aluminum alloy had also been barrel, leading to the belief that some balloons, or their internal structure, had
greater compressive strength than the alloy itself.
The Scanning electron micrographies from Fig. 4.5 show microstructure of the foam without strain (a) presenting balloons
with fibers and internal structures, and with strains of 3.35% (b), 30.09% (c) and 81.87% (d). Although the compressive
strength in Fig. 4.5b has been overcome, as can be seen in the graph of engineering stress versus compressive strain in Fig. 4.2,
no cracks were noted on the walls of the Fly Ash balloons. This fact reinforce the interpretation that the balloons have greater
resistance to compression than the metal walls that surround them. Therefore, it can be said that the deformation mechanism
present up to that moment was related to the plastic deformation of the foam’s metallic wall, possibly combined with a small
elastic deformation of the balloons.
Fig. 4.3 Strain mapping of specimen AMSF layers through image correlation via GOM Correlate software from ε ¼ 0% (a) to ε ¼ 30% (f)
4 Compressive Behavior of AlSiMg0.5Mn Matrix Syntactic Foam Produced. . .
23
observed portion is from the plates of the testing machine. Figure 4.4b, c represent orthogonal frames to the compression
direction at different heights of an AMSF sample with 30.9% deformation, the first being close to the upper solid layer of the
sample and the second close to the bottom and fixed plate of the testing machine. Therefore, the pores contained in the first
image have greater integrity than those of the second, compared to their undeformed state. Therefore, it can be concluded that
more central regions suffered lower levels of deformation, a fact that will be confirmed later when observing the mapping of
deformations located during the compression test.
Although visual identification of pores is not possible in Fig. 4.4d, AMSF still has 10.73% porosity, even after a
deformation of 81.87%. At that point in the compression test, not only had the AMSF portion been deformed, but the solid
portion of the aluminum alloy had also been barrel, leading to the belief that some balloons, or their internal structure, had
greater compressive strength than the alloy itself.
The Scanning electron micrographies from Fig. 4.5 show microstructure of the foam without strain (a) presenting balloons
with fibers and internal structures, and with strains of 3.35% (b), 30.09% (c) and 81.87% (d). Although the compressive
strength in Fig. 4.5b has been overcome, as can be seen in the graph of engineering stress versus compressive strain in Fig. 4.2,
no cracks were noted on the walls of the Fly Ash balloons. This fact reinforce the interpretation that the balloons have greater
resistance to compression than the metal walls that surround them. Therefore, it can be said that the deformation mechanism
present up to that moment was related to the plastic deformation of the foam’s metallic wall, possibly combined with a small
elastic deformation of the balloons.
Fig. 4.3 Strain mapping of specimen AMSF layers through image correlation via GOM Correlate software from ε ¼ 0% (a) to ε ¼ 30% (f)
4 Compressive Behavior of AlSiMg0.5Mn Matrix Syntactic Foam Produced. . .
23