

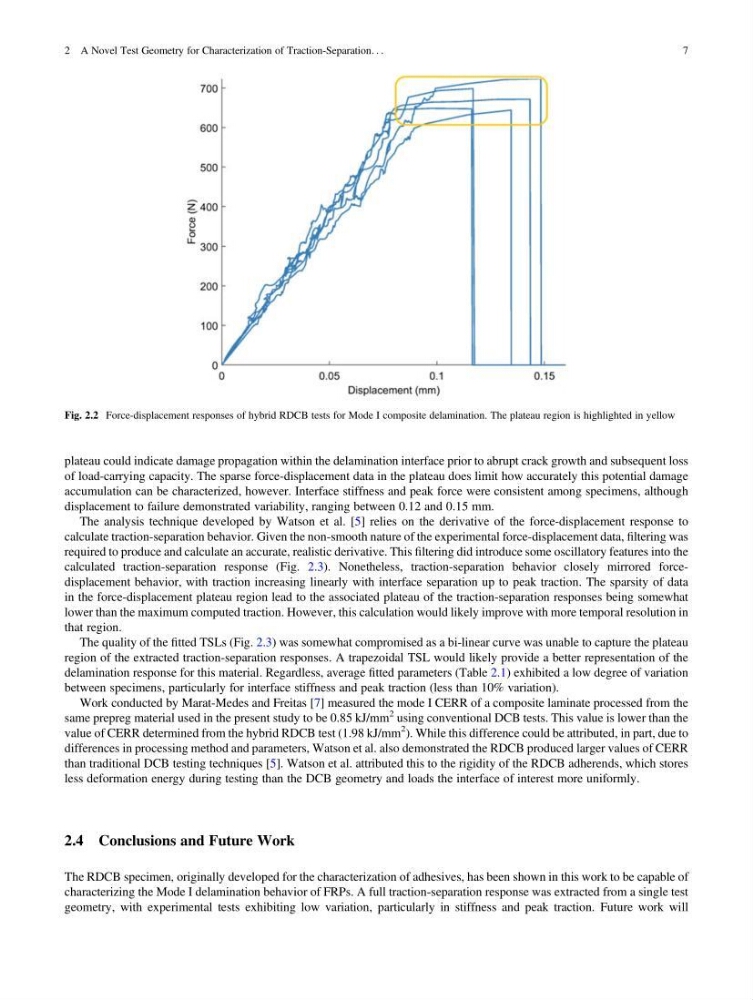
plateau could indicate damage propagation within the delamination interface prior to abrupt crack growth and subsequent loss
of load-carrying capacity. The sparse force-displacement data in the plateau does limit how accurately this potential damage
accumulation can be characterized, however. Interface stiffness and peak force were consistent among specimens, although
displacement to failure demonstrated variability, ranging between 0.12 and 0.15 mm.
The analysis technique developed by Watson et al. [5] relies on the derivative of the force-displacement response to
calculate traction-separation behavior. Given the non-smooth nature of the experimental force-displacement data, filtering was
required to produce and calculate an accurate, realistic derivative. This filtering did introduce some oscillatory features into the
calculated traction-separation response (Fig. 2.3). Nonetheless, traction-separation behavior closely mirrored forcedisplacement behavior, with traction increasing linearly with interface separation up to peak traction. The sparsity of data
in the force-displacement plateau region lead to the associated plateau of the traction-separation responses being somewhat
lower than the maximum computed traction. However, this calculation would likely improve with more temporal resolution in
that region.
The quality of the fitted TSLs (Fig. 2.3) was somewhat compromised as a bi-linear curve was unable to capture the plateau
region of the extracted traction-separation responses. A trapezoidal TSL would likely provide a better representation of the
delamination response for this material. Regardless, average fitted parameters (Table 2.1) exhibited a low degree of variation
between specimens, particularly for interface stiffness and peak traction (less than 10% variation).
Work conducted by Marat-Medes and Freitas [7] measured the mode I CERR of a composite laminate processed from the
same prepreg material used in the present study to be 0.85 kJ/mm
2 using conventional DCB tests. This value is lower than the
value of CERR determined from the hybrid RDCB test (1.98 kJ/mm
2 ). While this difference could be attributed, in part, due to
differences in processing method and parameters, Watson et al. also demonstrated the RDCB produced larger values of CERR
than traditional DCB testing techniques [5]. Watson et al. attributed this to the rigidity of the RDCB adherends, which stores
less deformation energy during testing than the DCB geometry and loads the interface of interest more uniformly.
2.4 Conclusions and Future Work
The RDCB specimen, originally developed for the characterization of adhesives, has been shown in this work to be capable of
characterizing the Mode I delamination behavior of FRPs. A full traction-separation response was extracted from a single test
geometry, with experimental tests exhibiting low variation, particularly in stiffness and peak traction. Future work will
Fig. 2.2 Force-displacement responses of hybrid RDCB tests for Mode I composite delamination. The plateau region is highlighted in yellow
2 A Novel Test Geometry for Characterization of Traction-Separation. . .
7
of load-carrying capacity. The sparse force-displacement data in the plateau does limit how accurately this potential damage
accumulation can be characterized, however. Interface stiffness and peak force were consistent among specimens, although
displacement to failure demonstrated variability, ranging between 0.12 and 0.15 mm.
The analysis technique developed by Watson et al. [5] relies on the derivative of the force-displacement response to
calculate traction-separation behavior. Given the non-smooth nature of the experimental force-displacement data, filtering was
required to produce and calculate an accurate, realistic derivative. This filtering did introduce some oscillatory features into the
calculated traction-separation response (Fig. 2.3). Nonetheless, traction-separation behavior closely mirrored forcedisplacement behavior, with traction increasing linearly with interface separation up to peak traction. The sparsity of data
in the force-displacement plateau region lead to the associated plateau of the traction-separation responses being somewhat
lower than the maximum computed traction. However, this calculation would likely improve with more temporal resolution in
that region.
The quality of the fitted TSLs (Fig. 2.3) was somewhat compromised as a bi-linear curve was unable to capture the plateau
region of the extracted traction-separation responses. A trapezoidal TSL would likely provide a better representation of the
delamination response for this material. Regardless, average fitted parameters (Table 2.1) exhibited a low degree of variation
between specimens, particularly for interface stiffness and peak traction (less than 10% variation).
Work conducted by Marat-Medes and Freitas [7] measured the mode I CERR of a composite laminate processed from the
same prepreg material used in the present study to be 0.85 kJ/mm
2 using conventional DCB tests. This value is lower than the
value of CERR determined from the hybrid RDCB test (1.98 kJ/mm
2 ). While this difference could be attributed, in part, due to
differences in processing method and parameters, Watson et al. also demonstrated the RDCB produced larger values of CERR
than traditional DCB testing techniques [5]. Watson et al. attributed this to the rigidity of the RDCB adherends, which stores
less deformation energy during testing than the DCB geometry and loads the interface of interest more uniformly.
2.4 Conclusions and Future Work
The RDCB specimen, originally developed for the characterization of adhesives, has been shown in this work to be capable of
characterizing the Mode I delamination behavior of FRPs. A full traction-separation response was extracted from a single test
geometry, with experimental tests exhibiting low variation, particularly in stiffness and peak traction. Future work will
Fig. 2.2 Force-displacement responses of hybrid RDCB tests for Mode I composite delamination. The plateau region is highlighted in yellow
2 A Novel Test Geometry for Characterization of Traction-Separation. . .
7