

2.3 SHPB Test
37
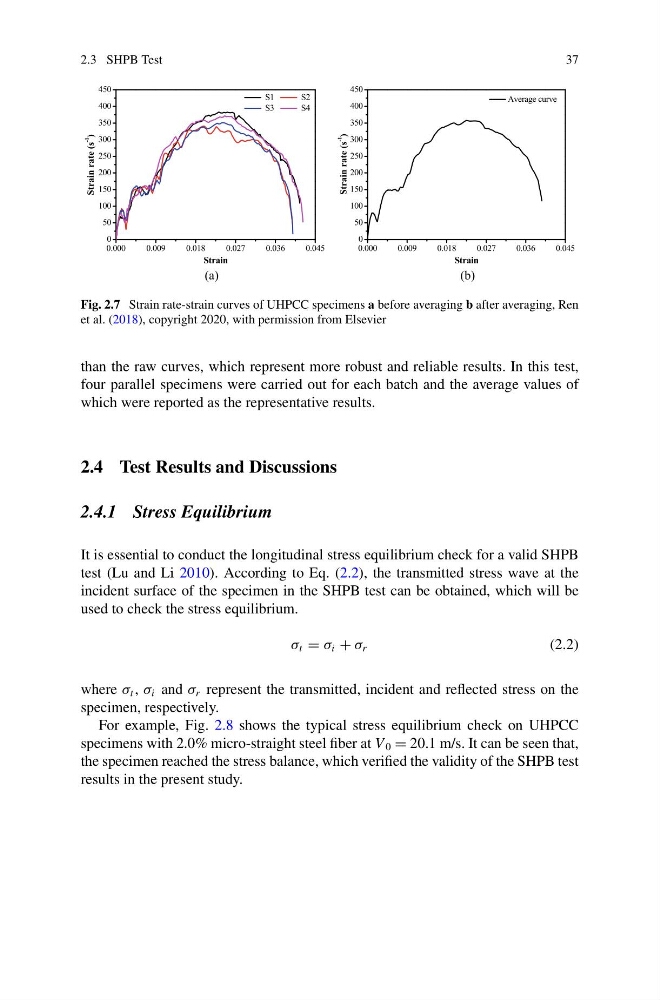
Fig. 2.7 Strain rate-strain curves of UHPCC specimens a before averaging b after averaging, Ren
et al. (2018), copyright 2020, with permission from Elsevier
than the raw curves, which represent more robust and reliable results. In this test,
four parallel specimens were carried out for each batch and the average values of
which were reported as the representative results.
2.4 Test Results and Discussions
2.4.1 Stress Equilibrium
It is essential to conduct the longitudinal stress equilibrium check for a valid SHPB
test (Lu and Li 2010). According to Eq. (2.2), the transmitted stress wave at the
incident surface of the specimen in the SHPB test can be obtained, which will be
used to check the stress equilibrium.
σ t = σ i + σ r
(2.2)
where σ t , σ i and σ r represent the transmitted, incident and reflected stress on the
specimen, respectively.
For example, Fig. 2.8 shows the typical stress equilibrium check on UHPCC
specimens with 2.0% micro-straight steel fiber at V 0 = 20.1 m/s. It can be seen that,
the specimen reached the stress balance, which verified the validity of the SHPB test
results in the present study.
37
Fig. 2.7 Strain rate-strain curves of UHPCC specimens a before averaging b after averaging, Ren
et al. (2018), copyright 2020, with permission from Elsevier
than the raw curves, which represent more robust and reliable results. In this test,
four parallel specimens were carried out for each batch and the average values of
which were reported as the representative results.
2.4 Test Results and Discussions
2.4.1 Stress Equilibrium
It is essential to conduct the longitudinal stress equilibrium check for a valid SHPB
test (Lu and Li 2010). According to Eq. (2.2), the transmitted stress wave at the
incident surface of the specimen in the SHPB test can be obtained, which will be
used to check the stress equilibrium.
σ t = σ i + σ r
(2.2)
where σ t , σ i and σ r represent the transmitted, incident and reflected stress on the
specimen, respectively.
For example, Fig. 2.8 shows the typical stress equilibrium check on UHPCC
specimens with 2.0% micro-straight steel fiber at V 0 = 20.1 m/s. It can be seen that,
the specimen reached the stress balance, which verified the validity of the SHPB test
results in the present study.