

14.2 UHPCC Material Model
485
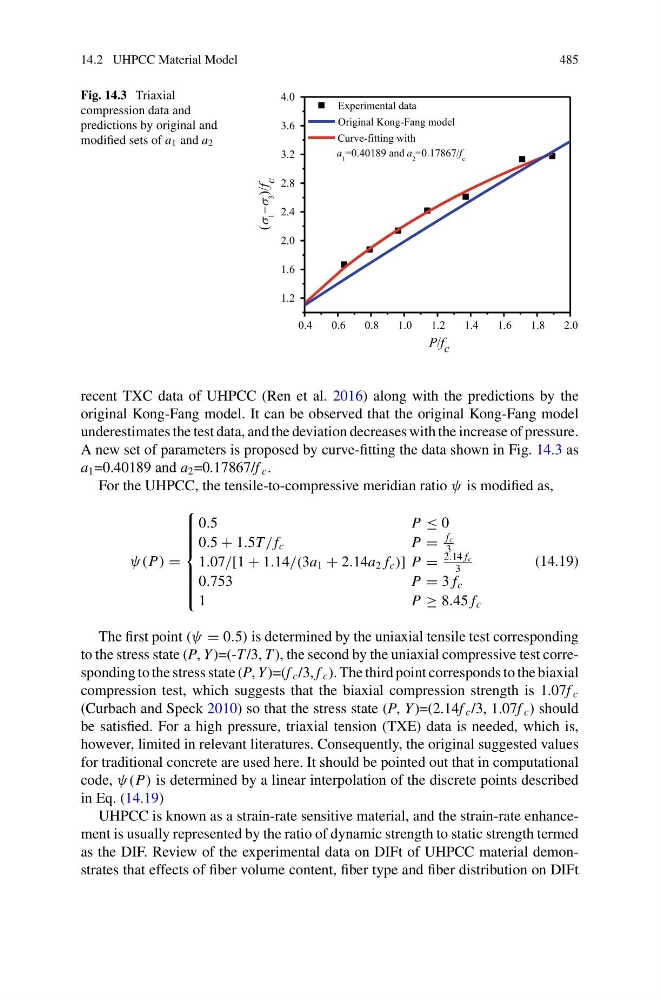
Fig. 14.3 Triaxial
compression data and
predictions by original and
modified sets of a 1 and a 2
0.4
0.6
0.8
1.0
1.2
1.4
1.6
1.8
2.0
1.2
1.6
2.0
2.4
2.8
3.2
3.6
4.0
P/f c
Experimental data
Original Kong-Fang model
Curve-fitting with
a 1 =0.40189 and a 2 =0.17867/f c
recent TXC data of UHPCC (Ren et al. 2016) along with the predictions by the
original Kong-Fang model. It can be observed that the original Kong-Fang model
underestimates the test data, and the deviation decreases with the increase of pressure.
A new set of parameters is proposed by curve-fitting the data shown in Fig. 14.3 as
a 1 =0.40189 and a 2 =0.17867/f c .
For the UHPCC, the tensile-to-compressive meridian ratio ψ is modified as,
ψ(P) =
⎧
⎪ ⎪ ⎪ ⎪ ⎪ ⎨
⎪ ⎪ ⎪ ⎪ ⎪ ⎩
0.5
P ≤ 0
0.5 + 1.5T / f c
P =
f c
3
1.07/[1 + 1.14/(3a 1 + 2.14a 2 f c )] P =
2.14 f c
3
0.753
P = 3 f c
1
P ≥ 8.45 f c
(14.19)
The first point (ψ = 0.5) is determined by the uniaxial tensile test corresponding
to the stress state (P, Y )=(-T /3, T ), the second by the uniaxial compressive test corresponding to the stress state (P, Y )=(f c /3, f c ). The third point corresponds to the biaxial
compression test, which suggests that the biaxial compression strength is 1.07f c
(Curbach and Speck 2010) so that the stress state (P, Y )=(2.14f c /3, 1.07f c ) should
be satisfied. For a high pressure, triaxial tension (TXE) data is needed, which is,
however, limited in relevant literatures. Consequently, the original suggested values
for traditional concrete are used here. It should be pointed out that in computational
code, ψ(P) is determined by a linear interpolation of the discrete points described
in Eq. (14.19)
UHPCC is known as a strain-rate sensitive material, and the strain-rate enhancement is usually represented by the ratio of dynamic strength to static strength termed
as the DIF. Review of the experimental data on DIFt of UHPCC material demonstrates that effects of fiber volume content, fiber type and fiber distribution on DIFt
485
Fig. 14.3 Triaxial
compression data and
predictions by original and
modified sets of a 1 and a 2
0.4
0.6
0.8
1.0
1.2
1.4
1.6
1.8
2.0
1.2
1.6
2.0
2.4
2.8
3.2
3.6
4.0
P/f c
Experimental data
Original Kong-Fang model
Curve-fitting with
a 1 =0.40189 and a 2 =0.17867/f c
recent TXC data of UHPCC (Ren et al. 2016) along with the predictions by the
original Kong-Fang model. It can be observed that the original Kong-Fang model
underestimates the test data, and the deviation decreases with the increase of pressure.
A new set of parameters is proposed by curve-fitting the data shown in Fig. 14.3 as
a 1 =0.40189 and a 2 =0.17867/f c .
For the UHPCC, the tensile-to-compressive meridian ratio ψ is modified as,
ψ(P) =
⎧
⎪ ⎪ ⎪ ⎪ ⎪ ⎨
⎪ ⎪ ⎪ ⎪ ⎪ ⎩
0.5
P ≤ 0
0.5 + 1.5T / f c
P =
f c
3
1.07/[1 + 1.14/(3a 1 + 2.14a 2 f c )] P =
2.14 f c
3
0.753
P = 3 f c
1
P ≥ 8.45 f c
(14.19)
The first point (ψ = 0.5) is determined by the uniaxial tensile test corresponding
to the stress state (P, Y )=(-T /3, T ), the second by the uniaxial compressive test corresponding to the stress state (P, Y )=(f c /3, f c ). The third point corresponds to the biaxial
compression test, which suggests that the biaxial compression strength is 1.07f c
(Curbach and Speck 2010) so that the stress state (P, Y )=(2.14f c /3, 1.07f c ) should
be satisfied. For a high pressure, triaxial tension (TXE) data is needed, which is,
however, limited in relevant literatures. Consequently, the original suggested values
for traditional concrete are used here. It should be pointed out that in computational
code, ψ(P) is determined by a linear interpolation of the discrete points described
in Eq. (14.19)
UHPCC is known as a strain-rate sensitive material, and the strain-rate enhancement is usually represented by the ratio of dynamic strength to static strength termed
as the DIF. Review of the experimental data on DIFt of UHPCC material demonstrates that effects of fiber volume content, fiber type and fiber distribution on DIFt