

464
13 Experimental and Numerical Studies on Dynamic Behavior …
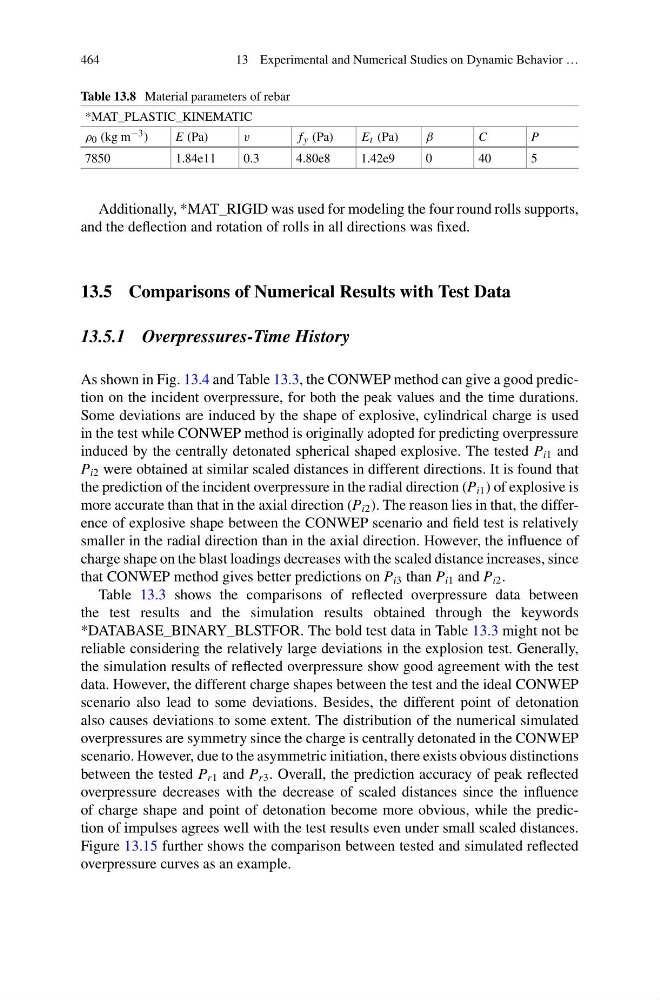
Table 13.8 Material parameters of rebar
*MAT_PLASTIC_KINEMATIC
ρ 0 (kg m −3 )
E (Pa)
v
f y (Pa)
E t (Pa)
β
C
P
7850
1.84e11
0.3
4.80e8
1.42e9
0
40
5
Additionally, *MAT_RIGID was used for modeling the four round rolls supports,
and the deflection and rotation of rolls in all directions was fixed.
13.5 Comparisons of Numerical Results with Test Data
13.5.1 Overpressures-Time History
As shown in Fig. 13.4 and Table 13.3, the CONWEP method can give a good prediction on the incident overpressure, for both the peak values and the time durations.
Some deviations are induced by the shape of explosive, cylindrical charge is used
in the test while CONWEP method is originally adopted for predicting overpressure
induced by the centrally detonated spherical shaped explosive. The tested P i1 and
P i2 were obtained at similar scaled distances in different directions. It is found that
the prediction of the incident overpressure in the radial direction (P i1 ) of explosive is
more accurate than that in the axial direction (P i2 ). The reason lies in that, the difference of explosive shape between the CONWEP scenario and field test is relatively
smaller in the radial direction than in the axial direction. However, the influence of
charge shape on the blast loadings decreases with the scaled distance increases, since
that CONWEP method gives better predictions on P i3 than P i1 and P i2 .
Table 13.3 shows the comparisons of reflected overpressure data between
the test results and the simulation results obtained through the keywords
*DATABASE_BINARY_BLSTFOR. The bold test data in Table 13.3 might not be
reliable considering the relatively large deviations in the explosion test. Generally,
the simulation results of reflected overpressure show good agreement with the test
data. However, the different charge shapes between the test and the ideal CONWEP
scenario also lead to some deviations. Besides, the different point of detonation
also causes deviations to some extent. The distribution of the numerical simulated
overpressures are symmetry since the charge is centrally detonated in the CONWEP
scenario. However, due to the asymmetric initiation, there exists obvious distinctions
between the tested P r1 and P r3 . Overall, the prediction accuracy of peak reflected
overpressure decreases with the decrease of scaled distances since the influence
of charge shape and point of detonation become more obvious, while the prediction of impulses agrees well with the test results even under small scaled distances.
Figure 13.15 further shows the comparison between tested and simulated reflected
overpressure curves as an example.
13 Experimental and Numerical Studies on Dynamic Behavior …
Table 13.8 Material parameters of rebar
*MAT_PLASTIC_KINEMATIC
ρ 0 (kg m −3 )
E (Pa)
v
f y (Pa)
E t (Pa)
β
C
P
7850
1.84e11
0.3
4.80e8
1.42e9
0
40
5
Additionally, *MAT_RIGID was used for modeling the four round rolls supports,
and the deflection and rotation of rolls in all directions was fixed.
13.5 Comparisons of Numerical Results with Test Data
13.5.1 Overpressures-Time History
As shown in Fig. 13.4 and Table 13.3, the CONWEP method can give a good prediction on the incident overpressure, for both the peak values and the time durations.
Some deviations are induced by the shape of explosive, cylindrical charge is used
in the test while CONWEP method is originally adopted for predicting overpressure
induced by the centrally detonated spherical shaped explosive. The tested P i1 and
P i2 were obtained at similar scaled distances in different directions. It is found that
the prediction of the incident overpressure in the radial direction (P i1 ) of explosive is
more accurate than that in the axial direction (P i2 ). The reason lies in that, the difference of explosive shape between the CONWEP scenario and field test is relatively
smaller in the radial direction than in the axial direction. However, the influence of
charge shape on the blast loadings decreases with the scaled distance increases, since
that CONWEP method gives better predictions on P i3 than P i1 and P i2 .
Table 13.3 shows the comparisons of reflected overpressure data between
the test results and the simulation results obtained through the keywords
*DATABASE_BINARY_BLSTFOR. The bold test data in Table 13.3 might not be
reliable considering the relatively large deviations in the explosion test. Generally,
the simulation results of reflected overpressure show good agreement with the test
data. However, the different charge shapes between the test and the ideal CONWEP
scenario also lead to some deviations. Besides, the different point of detonation
also causes deviations to some extent. The distribution of the numerical simulated
overpressures are symmetry since the charge is centrally detonated in the CONWEP
scenario. However, due to the asymmetric initiation, there exists obvious distinctions
between the tested P r1 and P r3 . Overall, the prediction accuracy of peak reflected
overpressure decreases with the decrease of scaled distances since the influence
of charge shape and point of detonation become more obvious, while the prediction of impulses agrees well with the test results even under small scaled distances.
Figure 13.15 further shows the comparison between tested and simulated reflected
overpressure curves as an example.