

13.4 Numerical Simulation
463
13.4.3 Material Model of NSC
At present, K&C model is also adopted for modeling NSC. The auto-generation
function is applied to determine the strength surface parameters, EOS parameters,
and 13 pairs of (λ, η) for NSC. Especially, based on the compressive stress-strain
relationship and tensile fracture energy calculated according to CEB-FIP model code
1990 (CEB 1993), b 1 = 3.042 and b 2 = 1.44 are determined through the single
element simulations. The DIF of NSC are referred from the CEB-FIP model code
1990 (CEB 1993).
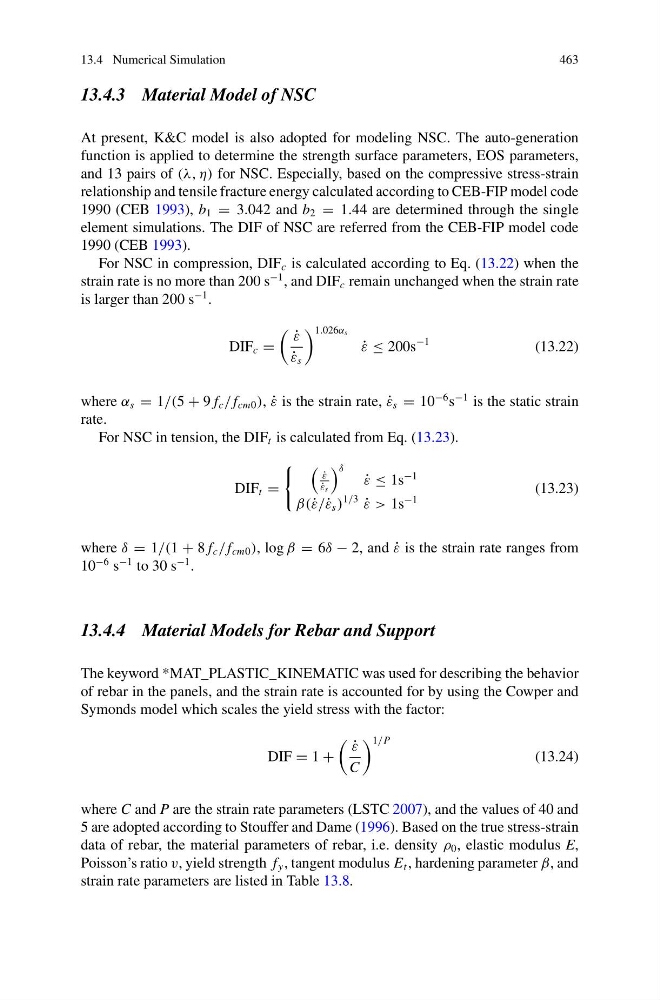
For NSC in compression, DIF c is calculated according to Eq. (13.22) when the
strain rate is no more than 200 s
−1 , and DIF c remain unchanged when the strain rate
is larger than 200 s
−1 .
DIF c =
˙
ε
˙
ε s
1.026α s
˙
ε ≤ 200s
−1
(13.22)
where α s = 1/(5 + 9 f c / f cm0 ), ˙
ε is the strain rate, ˙
ε s = 10
−6 s
−1 is the static strain
rate.
For NSC in tension, the DIF t is calculated from Eq. (13.23).
DIF t =
˙
ε
˙
ε s
δ ˙
ε ≤ 1s
−1
β(˙ ε/˙ ε s )
1/3
˙
ε > 1s
−1
(13.23)
where δ = 1/(1 + 8 f c / f cm0 ), log β = 6δ − 2, and ˙
ε is the strain rate ranges from
10
−6 s
−1 to 30 s
−1 .
13.4.4 Material Models for Rebar and Support
The keyword *MAT_PLASTIC_KINEMATIC was used for describing the behavior
of rebar in the panels, and the strain rate is accounted for by using the Cowper and
Symonds model which scales the yield stress with the factor:
DIF = 1 +
˙
ε
C
1/P
(13.24)
where C and P are the strain rate parameters (LSTC 2007), and the values of 40 and
5 are adopted according to Stouffer and Dame (1996). Based on the true stress-strain
data of rebar, the material parameters of rebar, i.e. density ρ 0 , elastic modulus E,
Poisson’s ratio v, yield strength f y , tangent modulus E t , hardening parameter β, and
strain rate parameters are listed in Table 13.8.
463
13.4.3 Material Model of NSC
At present, K&C model is also adopted for modeling NSC. The auto-generation
function is applied to determine the strength surface parameters, EOS parameters,
and 13 pairs of (λ, η) for NSC. Especially, based on the compressive stress-strain
relationship and tensile fracture energy calculated according to CEB-FIP model code
1990 (CEB 1993), b 1 = 3.042 and b 2 = 1.44 are determined through the single
element simulations. The DIF of NSC are referred from the CEB-FIP model code
1990 (CEB 1993).
For NSC in compression, DIF c is calculated according to Eq. (13.22) when the
strain rate is no more than 200 s
−1 , and DIF c remain unchanged when the strain rate
is larger than 200 s
−1 .
DIF c =
˙
ε
˙
ε s
1.026α s
˙
ε ≤ 200s
−1
(13.22)
where α s = 1/(5 + 9 f c / f cm0 ), ˙
ε is the strain rate, ˙
ε s = 10
−6 s
−1 is the static strain
rate.
For NSC in tension, the DIF t is calculated from Eq. (13.23).
DIF t =
˙
ε
˙
ε s
δ ˙
ε ≤ 1s
−1
β(˙ ε/˙ ε s )
1/3
˙
ε > 1s
−1
(13.23)
where δ = 1/(1 + 8 f c / f cm0 ), log β = 6δ − 2, and ˙
ε is the strain rate ranges from
10
−6 s
−1 to 30 s
−1 .
13.4.4 Material Models for Rebar and Support
The keyword *MAT_PLASTIC_KINEMATIC was used for describing the behavior
of rebar in the panels, and the strain rate is accounted for by using the Cowper and
Symonds model which scales the yield stress with the factor:
DIF = 1 +
˙
ε
C
1/P
(13.24)
where C and P are the strain rate parameters (LSTC 2007), and the values of 40 and
5 are adopted according to Stouffer and Dame (1996). Based on the true stress-strain
data of rebar, the material parameters of rebar, i.e. density ρ 0 , elastic modulus E,
Poisson’s ratio v, yield strength f y , tangent modulus E t , hardening parameter β, and
strain rate parameters are listed in Table 13.8.