

13.4 Numerical Simulation
457
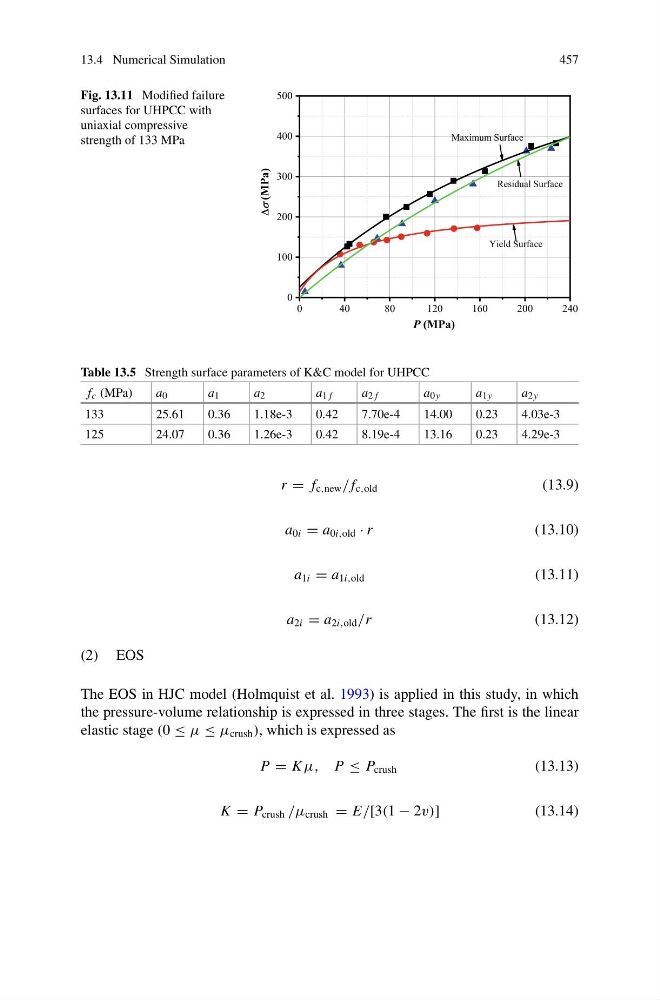
Fig. 13.11 Modified failure
surfaces for UHPCC with
uniaxial compressive
strength of 133 MPa
0
40
80
120
160
200
240
0
100
200
300
400
500
Residual Surface
Yield Surface
Maximum Surface
(MPa)
P (MPa)
Table 13.5 Strength surface parameters of K&C model for UHPCC
f c (MPa)
a 0
a 1
a 2
a 1 f
a 2 f
a 0y
a 1y
a 2y
133
25.61
0.36
1.18e-3
0.42
7.70e-4
14.00
0.23
4.03e-3
125
24.07
0.36
1.26e-3
0.42
8.19e-4
13.16
0.23
4.29e-3
r = f c,new / f c,old
(13.9)
a 0i = a 0i,old · r
(13.10)
a 1i = a 1i,old
(13.11)
a 2i = a 2i,old /r
(13.12)
(2) EOS
The EOS in HJC model (Holmquist et al. 1993) is applied in this study, in which
the pressure-volume relationship is expressed in three stages. The first is the linear
elastic stage (0 ≤ μ ≤ μ crush ), which is expressed as
P = K μ, P ≤ P crush
(13.13)
K = P crush /μ crush = E/[3(1 − 2v)]
(13.14)
457
Fig. 13.11 Modified failure
surfaces for UHPCC with
uniaxial compressive
strength of 133 MPa
0
40
80
120
160
200
240
0
100
200
300
400
500
Residual Surface
Yield Surface
Maximum Surface
(MPa)
P (MPa)
Table 13.5 Strength surface parameters of K&C model for UHPCC
f c (MPa)
a 0
a 1
a 2
a 1 f
a 2 f
a 0y
a 1y
a 2y
133
25.61
0.36
1.18e-3
0.42
7.70e-4
14.00
0.23
4.03e-3
125
24.07
0.36
1.26e-3
0.42
8.19e-4
13.16
0.23
4.29e-3
r = f c,new / f c,old
(13.9)
a 0i = a 0i,old · r
(13.10)
a 1i = a 1i,old
(13.11)
a 2i = a 2i,old /r
(13.12)
(2) EOS
The EOS in HJC model (Holmquist et al. 1993) is applied in this study, in which
the pressure-volume relationship is expressed in three stages. The first is the linear
elastic stage (0 ≤ μ ≤ μ crush ), which is expressed as
P = K μ, P ≤ P crush
(13.13)
K = P crush /μ crush = E/[3(1 − 2v)]
(13.14)