

12.4 Low-Frequency Cyclic Loading Test
421
monotonically with the increase of TNT charge weights. It can be explained that,
at the early stage of cyclic loading, C-13 specimen first exhibits one major crack,
and subsequently the second major crack is developed at the late stage of loading
cycle to dissipate energy. While for the C-12 column, only one major crack occurs
at the blast induced crater to sustain plastic deformation. Hence, the cumulative
hysteresis energy of C-13 column is higher than that of C-12 column. However, with
further increasing TNT charge weight, the cumulative hysteresis energy of specimen
decreased rapidly.
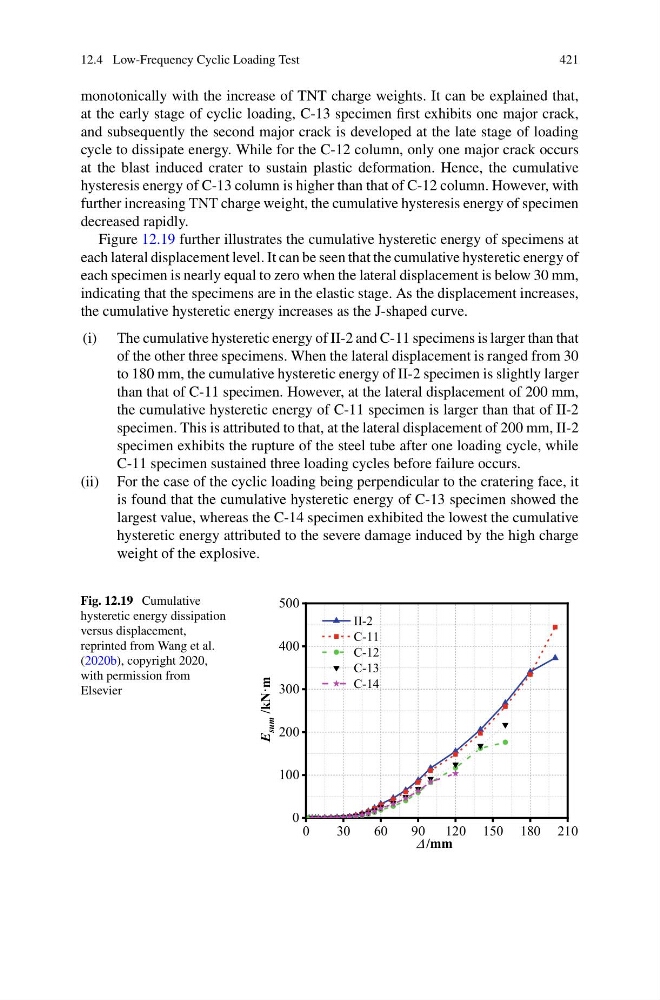
Figure 12.19 further illustrates the cumulative hysteretic energy of specimens at
each lateral displacement level. It can be seen that the cumulative hysteretic energy of
each specimen is nearly equal to zero when the lateral displacement is below 30 mm,
indicating that the specimens are in the elastic stage. As the displacement increases,
the cumulative hysteretic energy increases as the J-shaped curve.
(i) The cumulative hysteretic energy of II-2 and C-11 specimens is larger than that
of the other three specimens. When the lateral displacement is ranged from 30
to 180 mm, the cumulative hysteretic energy of II-2 specimen is slightly larger
than that of C-11 specimen. However, at the lateral displacement of 200 mm,
the cumulative hysteretic energy of C-11 specimen is larger than that of II-2
specimen. This is attributed to that, at the lateral displacement of 200 mm, II-2
specimen exhibits the rupture of the steel tube after one loading cycle, while
C-11 specimen sustained three loading cycles before failure occurs.
(ii) For the case of the cyclic loading being perpendicular to the cratering face, it
is found that the cumulative hysteretic energy of C-13 specimen showed the
largest value, whereas the C-14 specimen exhibited the lowest the cumulative
hysteretic energy attributed to the severe damage induced by the high charge
weight of the explosive.
Fig. 12.19 Cumulative
hysteretic energy dissipation
versus displacement,
reprinted from Wang et al.
(2020b), copyright 2020,
with permission from
Elsevier
0
30
60
90 120 150 180 210
0
100
200
300
400
500
II-2
C-11
C-12
C-13
C-14
E
sum /kN·m
/mm
421
monotonically with the increase of TNT charge weights. It can be explained that,
at the early stage of cyclic loading, C-13 specimen first exhibits one major crack,
and subsequently the second major crack is developed at the late stage of loading
cycle to dissipate energy. While for the C-12 column, only one major crack occurs
at the blast induced crater to sustain plastic deformation. Hence, the cumulative
hysteresis energy of C-13 column is higher than that of C-12 column. However, with
further increasing TNT charge weight, the cumulative hysteresis energy of specimen
decreased rapidly.
Figure 12.19 further illustrates the cumulative hysteretic energy of specimens at
each lateral displacement level. It can be seen that the cumulative hysteretic energy of
each specimen is nearly equal to zero when the lateral displacement is below 30 mm,
indicating that the specimens are in the elastic stage. As the displacement increases,
the cumulative hysteretic energy increases as the J-shaped curve.
(i) The cumulative hysteretic energy of II-2 and C-11 specimens is larger than that
of the other three specimens. When the lateral displacement is ranged from 30
to 180 mm, the cumulative hysteretic energy of II-2 specimen is slightly larger
than that of C-11 specimen. However, at the lateral displacement of 200 mm,
the cumulative hysteretic energy of C-11 specimen is larger than that of II-2
specimen. This is attributed to that, at the lateral displacement of 200 mm, II-2
specimen exhibits the rupture of the steel tube after one loading cycle, while
C-11 specimen sustained three loading cycles before failure occurs.
(ii) For the case of the cyclic loading being perpendicular to the cratering face, it
is found that the cumulative hysteretic energy of C-13 specimen showed the
largest value, whereas the C-14 specimen exhibited the lowest the cumulative
hysteretic energy attributed to the severe damage induced by the high charge
weight of the explosive.
Fig. 12.19 Cumulative
hysteretic energy dissipation
versus displacement,
reprinted from Wang et al.
(2020b), copyright 2020,
with permission from
Elsevier
0
30
60
90 120 150 180 210
0
100
200
300
400
500
II-2
C-11
C-12
C-13
C-14
E
sum /kN·m
/mm