

12.4 Low-Frequency Cyclic Loading Test
417
12.4.2.4 Load-Carrying Capacity and Ductility
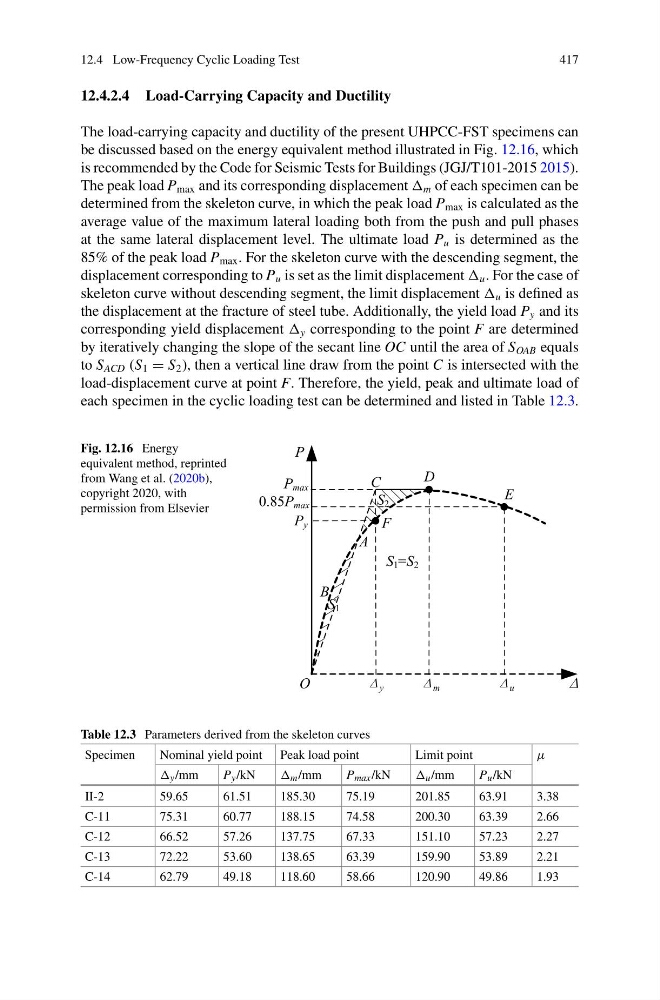
The load-carrying capacity and ductility of the present UHPCC-FST specimens can
be discussed based on the energy equivalent method illustrated in Fig. 12.16, which
is recommended by the Code for Seismic Tests for Buildings (JGJ/T101-2015 2015).
The peak load P max and its corresponding displacement m of each specimen can be
determined from the skeleton curve, in which the peak load P max is calculated as the
average value of the maximum lateral loading both from the push and pull phases
at the same lateral displacement level. The ultimate load P u is determined as the
85% of the peak load P max . For the skeleton curve with the descending segment, the
displacement corresponding to P u is set as the limit displacement u . For the case of
skeleton curve without descending segment, the limit displacement u is defined as
the displacement at the fracture of steel tube. Additionally, the yield load P y and its
corresponding yield displacement y corresponding to the point F are determined
by iteratively changing the slope of the secant line OC until the area of S OAB equals
to S ACD (S 1 = S 2 ), then a vertical line draw from the point C is intersected with the
load-displacement curve at point F. Therefore, the yield, peak and ultimate load of
each specimen in the cyclic loading test can be determined and listed in Table 12.3.
Fig. 12.16 Energy
equivalent method, reprinted
from Wang et al. (2020b),
copyright 2020, with
permission from Elsevier
P max
0.85P max
P y
O
P
y
m
u
S 1
S 2
S 1 =S 2
A
B
C
D
E
F
Table 12.3 Parameters derived from the skeleton curves
Specimen
Nominal yield point Peak load point
Limit point
μ
y /mm
P y /kN
m /mm
P max /kN
u /mm
P u /kN
II-2
59.65
61.51
185.30
75.19
201.85
63.91
3.38
C-11
75.31
60.77
188.15
74.58
200.30
63.39
2.66
C-12
66.52
57.26
137.75
67.33
151.10
57.23
2.27
C-13
72.22
53.60
138.65
63.39
159.90
53.89
2.21
C-14
62.79
49.18
118.60
58.66
120.90
49.86
1.93
417
12.4.2.4 Load-Carrying Capacity and Ductility
The load-carrying capacity and ductility of the present UHPCC-FST specimens can
be discussed based on the energy equivalent method illustrated in Fig. 12.16, which
is recommended by the Code for Seismic Tests for Buildings (JGJ/T101-2015 2015).
The peak load P max and its corresponding displacement m of each specimen can be
determined from the skeleton curve, in which the peak load P max is calculated as the
average value of the maximum lateral loading both from the push and pull phases
at the same lateral displacement level. The ultimate load P u is determined as the
85% of the peak load P max . For the skeleton curve with the descending segment, the
displacement corresponding to P u is set as the limit displacement u . For the case of
skeleton curve without descending segment, the limit displacement u is defined as
the displacement at the fracture of steel tube. Additionally, the yield load P y and its
corresponding yield displacement y corresponding to the point F are determined
by iteratively changing the slope of the secant line OC until the area of S OAB equals
to S ACD (S 1 = S 2 ), then a vertical line draw from the point C is intersected with the
load-displacement curve at point F. Therefore, the yield, peak and ultimate load of
each specimen in the cyclic loading test can be determined and listed in Table 12.3.
Fig. 12.16 Energy
equivalent method, reprinted
from Wang et al. (2020b),
copyright 2020, with
permission from Elsevier
P max
0.85P max
P y
O
P
y
m
u
S 1
S 2
S 1 =S 2
A
B
C
D
E
F
Table 12.3 Parameters derived from the skeleton curves
Specimen
Nominal yield point Peak load point
Limit point
μ
y /mm
P y /kN
m /mm
P max /kN
u /mm
P u /kN
II-2
59.65
61.51
185.30
75.19
201.85
63.91
3.38
C-11
75.31
60.77
188.15
74.58
200.30
63.39
2.66
C-12
66.52
57.26
137.75
67.33
151.10
57.23
2.27
C-13
72.22
53.60
138.65
63.39
159.90
53.89
2.21
C-14
62.79
49.18
118.60
58.66
120.90
49.86
1.93