

12.4 Low-Frequency Cyclic Loading Test
409
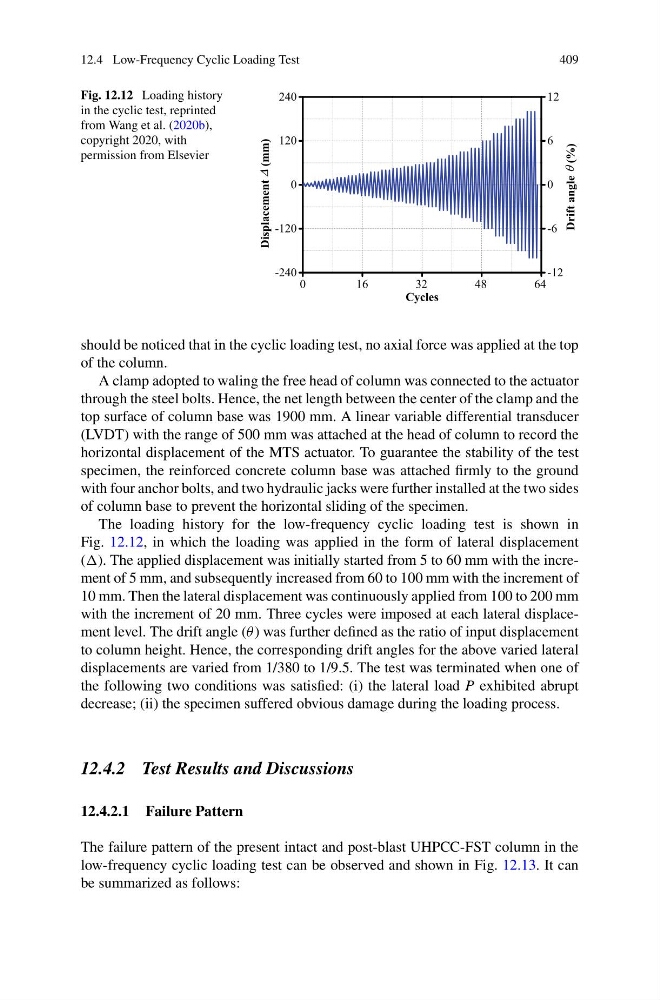
Fig. 12.12 Loading history
in the cyclic test, reprinted
from Wang et al. (2020b),
copyright 2020, with
permission from Elsevier
0
1 6
3 2
4 8
6 4
-240
-120
0
120
240
Displacement (mm)
Cycles
-12
-6
0
6
12
Drift angle
(%)
should be noticed that in the cyclic loading test, no axial force was applied at the top
of the column.
A clamp adopted to waling the free head of column was connected to the actuator
through the steel bolts. Hence, the net length between the center of the clamp and the
top surface of column base was 1900 mm. A linear variable differential transducer
(LVDT) with the range of 500 mm was attached at the head of column to record the
horizontal displacement of the MTS actuator. To guarantee the stability of the test
specimen, the reinforced concrete column base was attached firmly to the ground
with four anchor bolts, and two hydraulic jacks were further installed at the two sides
of column base to prevent the horizontal sliding of the specimen.
The loading history for the low-frequency cyclic loading test is shown in
Fig. 12.12, in which the loading was applied in the form of lateral displacement
(). The applied displacement was initially started from 5 to 60 mm with the increment of 5 mm, and subsequently increased from 60 to 100 mm with the increment of
10 mm. Then the lateral displacement was continuously applied from 100 to 200 mm
with the increment of 20 mm. Three cycles were imposed at each lateral displacement level. The drift angle (θ ) was further defined as the ratio of input displacement
to column height. Hence, the corresponding drift angles for the above varied lateral
displacements are varied from 1/380 to 1/9.5. The test was terminated when one of
the following two conditions was satisfied: (i) the lateral load P exhibited abrupt
decrease; (ii) the specimen suffered obvious damage during the loading process.
12.4.2 Test Results and Discussions
12.4.2.1 Failure Pattern
The failure pattern of the present intact and post-blast UHPCC-FST column in the
low-frequency cyclic loading test can be observed and shown in Fig. 12.13. It can
be summarized as follows:
409
Fig. 12.12 Loading history
in the cyclic test, reprinted
from Wang et al. (2020b),
copyright 2020, with
permission from Elsevier
0
1 6
3 2
4 8
6 4
-240
-120
0
120
240
Displacement (mm)
Cycles
-12
-6
0
6
12
Drift angle
(%)
should be noticed that in the cyclic loading test, no axial force was applied at the top
of the column.
A clamp adopted to waling the free head of column was connected to the actuator
through the steel bolts. Hence, the net length between the center of the clamp and the
top surface of column base was 1900 mm. A linear variable differential transducer
(LVDT) with the range of 500 mm was attached at the head of column to record the
horizontal displacement of the MTS actuator. To guarantee the stability of the test
specimen, the reinforced concrete column base was attached firmly to the ground
with four anchor bolts, and two hydraulic jacks were further installed at the two sides
of column base to prevent the horizontal sliding of the specimen.
The loading history for the low-frequency cyclic loading test is shown in
Fig. 12.12, in which the loading was applied in the form of lateral displacement
(). The applied displacement was initially started from 5 to 60 mm with the increment of 5 mm, and subsequently increased from 60 to 100 mm with the increment of
10 mm. Then the lateral displacement was continuously applied from 100 to 200 mm
with the increment of 20 mm. Three cycles were imposed at each lateral displacement level. The drift angle (θ ) was further defined as the ratio of input displacement
to column height. Hence, the corresponding drift angles for the above varied lateral
displacements are varied from 1/380 to 1/9.5. The test was terminated when one of
the following two conditions was satisfied: (i) the lateral load P exhibited abrupt
decrease; (ii) the specimen suffered obvious damage during the loading process.
12.4.2 Test Results and Discussions
12.4.2.1 Failure Pattern
The failure pattern of the present intact and post-blast UHPCC-FST column in the
low-frequency cyclic loading test can be observed and shown in Fig. 12.13. It can
be summarized as follows: