

10.7 Comparisons with Test Data
349
250
Original contour line
38
(a)
R3
(b)
Fig. 10.20 Numerical simulation results for column C-2 a vertical view b horizontal view
(units mm), reprinted from Wang et al. (2020a, b), copyright 2020, with permission from Elsevier
250
Original contour line
38
(a)
R1
R2
R3
(b)
Fig. 10.21 Numerical simulation results for column C-3 a vertical view b horizontal view
(units mm), reprinted from Wang et al. (2020a, b), copyright 2020, with permission from Elsevier
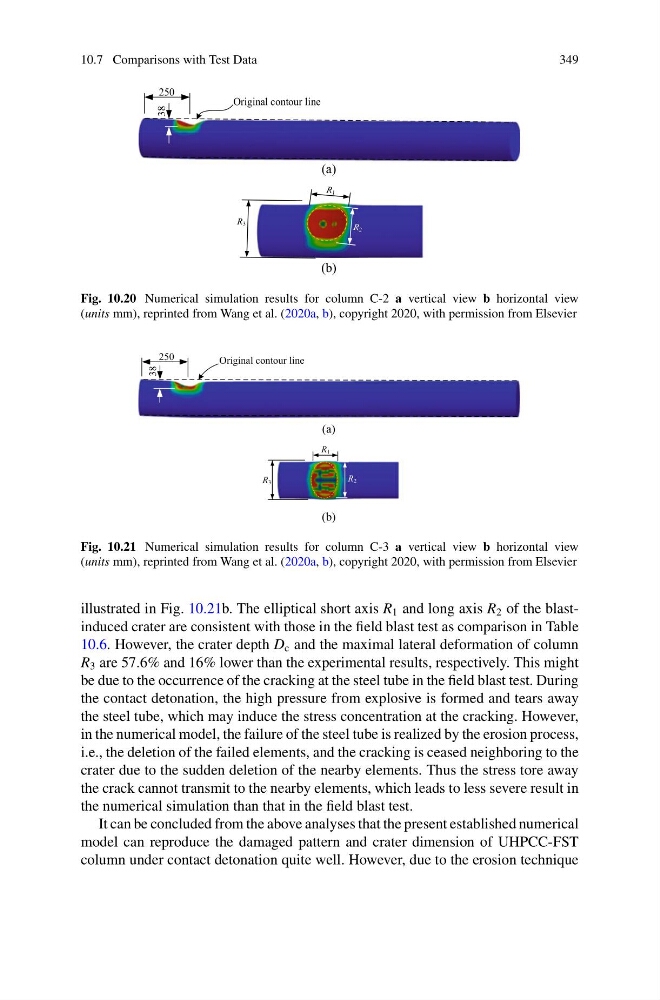
illustrated in Fig. 10.21b. The elliptical short axis R 1 and long axis R 2 of the blastinduced crater are consistent with those in the field blast test as comparison in Table
10.6. However, the crater depth D c and the maximal lateral deformation of column
R 3 are 57.6% and 16% lower than the experimental results, respectively. This might
be due to the occurrence of the cracking at the steel tube in the field blast test. During
the contact detonation, the high pressure from explosive is formed and tears away
the steel tube, which may induce the stress concentration at the cracking. However,
in the numerical model, the failure of the steel tube is realized by the erosion process,
i.e., the deletion of the failed elements, and the cracking is ceased neighboring to the
crater due to the sudden deletion of the nearby elements. Thus the stress tore away
the crack cannot transmit to the nearby elements, which leads to less severe result in
the numerical simulation than that in the field blast test.
It can be concluded from the above analyses that the present established numerical
model can reproduce the damaged pattern and crater dimension of UHPCC-FST
column under contact detonation quite well. However, due to the erosion technique
349
250
Original contour line
38
(a)
R3
(b)
Fig. 10.20 Numerical simulation results for column C-2 a vertical view b horizontal view
(units mm), reprinted from Wang et al. (2020a, b), copyright 2020, with permission from Elsevier
250
Original contour line
38
(a)
R1
R2
R3
(b)
Fig. 10.21 Numerical simulation results for column C-3 a vertical view b horizontal view
(units mm), reprinted from Wang et al. (2020a, b), copyright 2020, with permission from Elsevier
illustrated in Fig. 10.21b. The elliptical short axis R 1 and long axis R 2 of the blastinduced crater are consistent with those in the field blast test as comparison in Table
10.6. However, the crater depth D c and the maximal lateral deformation of column
R 3 are 57.6% and 16% lower than the experimental results, respectively. This might
be due to the occurrence of the cracking at the steel tube in the field blast test. During
the contact detonation, the high pressure from explosive is formed and tears away
the steel tube, which may induce the stress concentration at the cracking. However,
in the numerical model, the failure of the steel tube is realized by the erosion process,
i.e., the deletion of the failed elements, and the cracking is ceased neighboring to the
crater due to the sudden deletion of the nearby elements. Thus the stress tore away
the crack cannot transmit to the nearby elements, which leads to less severe result in
the numerical simulation than that in the field blast test.
It can be concluded from the above analyses that the present established numerical
model can reproduce the damaged pattern and crater dimension of UHPCC-FST
column under contact detonation quite well. However, due to the erosion technique