

1.4 Test Results and Discussion
15
0.000
0.002
0.004
0.006
0.008
0.010
0
1
2
3
4
5
6
7
8
H500-2.0-S1
H500-2.0-S2
H500-2.0-S3
Tensile strength (MPa)
Strain
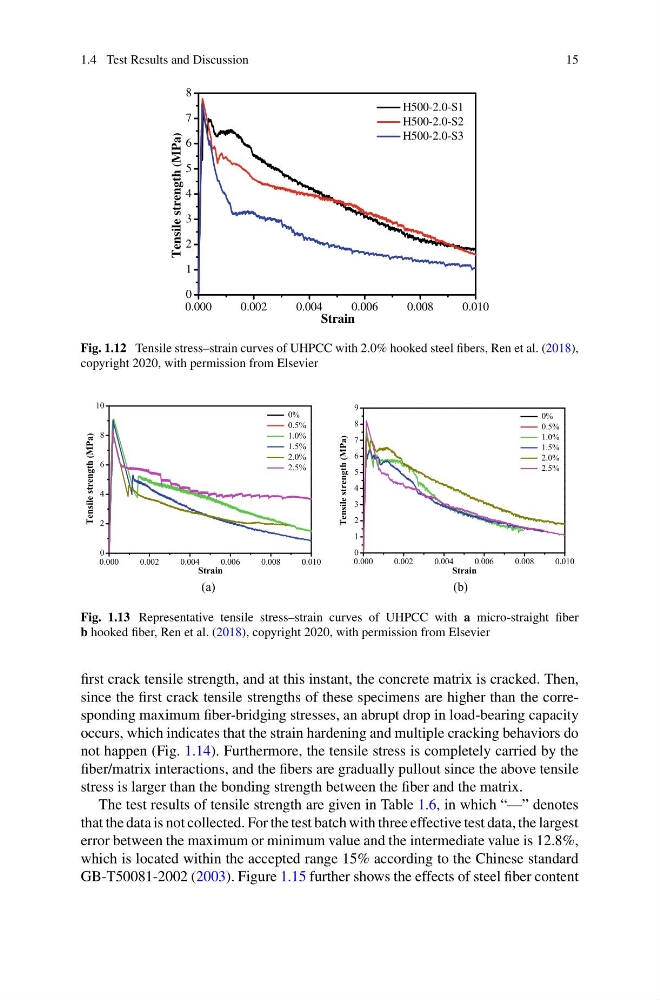
Fig. 1.12 Tensile stress–strain curves of UHPCC with 2.0% hooked steel fibers, Ren et al. (2018),
copyright 2020, with permission from Elsevier
0.000
0.002
0.004
0.006
0.008
0.010
0
2
4
6
8
10
Strain
Tensile strength (MPa)
0%
0.5%
1.0%
1.5%
2.0%
2.5%
0.000
0.002
0.004
0.006
0.008
0.010
0
1
2
3
4
5
6
7
8
9
Tensile strength (MPa)
Strain
0%
0.5%
1.0%
1.5%
2.0%
2.5%
(a)
(b)
Fig. 1.13 Representative tensile stress–strain curves of UHPCC with a micro-straight fiber
b hooked fiber, Ren et al. (2018), copyright 2020, with permission from Elsevier
first crack tensile strength, and at this instant, the concrete matrix is cracked. Then,
since the first crack tensile strengths of these specimens are higher than the corresponding maximum fiber-bridging stresses, an abrupt drop in load-bearing capacity
occurs, which indicates that the strain hardening and multiple cracking behaviors do
not happen (Fig. 1.14). Furthermore, the tensile stress is completely carried by the
fiber/matrix interactions, and the fibers are gradually pullout since the above tensile
stress is larger than the bonding strength between the fiber and the matrix.
The test results of tensile strength are given in Table 1.6, in which “—” denotes
that the data is not collected. For the test batch with three effective test data, the largest
error between the maximum or minimum value and the intermediate value is 12.8%,
which is located within the accepted range 15% according to the Chinese standard
GB-T50081-2002 (2003). Figure 1.15 further shows the effects of steel fiber content
15
0.000
0.002
0.004
0.006
0.008
0.010
0
1
2
3
4
5
6
7
8
H500-2.0-S1
H500-2.0-S2
H500-2.0-S3
Tensile strength (MPa)
Strain
Fig. 1.12 Tensile stress–strain curves of UHPCC with 2.0% hooked steel fibers, Ren et al. (2018),
copyright 2020, with permission from Elsevier
0.000
0.002
0.004
0.006
0.008
0.010
0
2
4
6
8
10
Strain
Tensile strength (MPa)
0%
0.5%
1.0%
1.5%
2.0%
2.5%
0.000
0.002
0.004
0.006
0.008
0.010
0
1
2
3
4
5
6
7
8
9
Tensile strength (MPa)
Strain
0%
0.5%
1.0%
1.5%
2.0%
2.5%
(a)
(b)
Fig. 1.13 Representative tensile stress–strain curves of UHPCC with a micro-straight fiber
b hooked fiber, Ren et al. (2018), copyright 2020, with permission from Elsevier
first crack tensile strength, and at this instant, the concrete matrix is cracked. Then,
since the first crack tensile strengths of these specimens are higher than the corresponding maximum fiber-bridging stresses, an abrupt drop in load-bearing capacity
occurs, which indicates that the strain hardening and multiple cracking behaviors do
not happen (Fig. 1.14). Furthermore, the tensile stress is completely carried by the
fiber/matrix interactions, and the fibers are gradually pullout since the above tensile
stress is larger than the bonding strength between the fiber and the matrix.
The test results of tensile strength are given in Table 1.6, in which “—” denotes
that the data is not collected. For the test batch with three effective test data, the largest
error between the maximum or minimum value and the intermediate value is 12.8%,
which is located within the accepted range 15% according to the Chinese standard
GB-T50081-2002 (2003). Figure 1.15 further shows the effects of steel fiber content