

14
1 Static Mechanical Properties of UHPCC
0.0
0.5
1.0
1.5
2.0
2.5
3.0
80
90
100
110
120
130
140
150
Axial compressive strength (MPa)
Steel fiber content (%)
Micro-straight
Hooked
0.0
0.5
1.0
1.5
2.0
2.5
3.0
20
30
40
50
60
70
Compressive elastic modulus (GPa)
Steel fiber content (%)
Micro-straight
Hooked
0.0
0.5
1.0
1.5
2.0
2.5
3.0
0.10
0.15
0.20
0.25
0.30
0.35
Poisson's ratio
Steel fiber content (%)
Micro-straight
Hooked
(c)
(a)
(b)
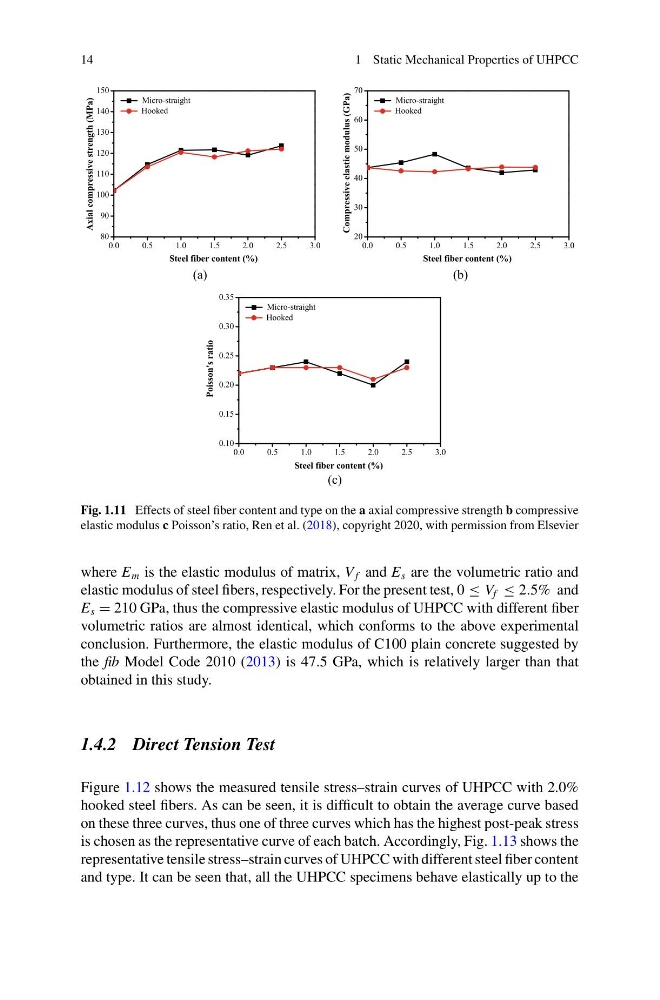
Fig. 1.11 Effects of steel fiber content and type on the a axial compressive strength b compressive
elastic modulus c Poisson’s ratio, Ren et al. (2018), copyright 2020, with permission from Elsevier
where E m is the elastic modulus of matrix, V f and E s are the volumetric ratio and
elastic modulus of steel fibers, respectively. For the present test, 0 ≤ V f ≤ 2.5% and
E s = 210 GPa, thus the compressive elastic modulus of UHPCC with different fiber
volumetric ratios are almost identical, which conforms to the above experimental
conclusion. Furthermore, the elastic modulus of C100 plain concrete suggested by
the fib Model Code 2010 (2013) is 47.5 GPa, which is relatively larger than that
obtained in this study.
1.4.2 Direct Tension Test
Figure 1.12 shows the measured tensile stress–strain curves of UHPCC with 2.0%
hooked steel fibers. As can be seen, it is difficult to obtain the average curve based
on these three curves, thus one of three curves which has the highest post-peak stress
is chosen as the representative curve of each batch. Accordingly, Fig. 1.13 shows the
representative tensile stress–strain curves of UHPCC with different steel fiber content
and type. It can be seen that, all the UHPCC specimens behave elastically up to the
1 Static Mechanical Properties of UHPCC
0.0
0.5
1.0
1.5
2.0
2.5
3.0
80
90
100
110
120
130
140
150
Axial compressive strength (MPa)
Steel fiber content (%)
Micro-straight
Hooked
0.0
0.5
1.0
1.5
2.0
2.5
3.0
20
30
40
50
60
70
Compressive elastic modulus (GPa)
Steel fiber content (%)
Micro-straight
Hooked
0.0
0.5
1.0
1.5
2.0
2.5
3.0
0.10
0.15
0.20
0.25
0.30
0.35
Poisson's ratio
Steel fiber content (%)
Micro-straight
Hooked
(c)
(a)
(b)
Fig. 1.11 Effects of steel fiber content and type on the a axial compressive strength b compressive
elastic modulus c Poisson’s ratio, Ren et al. (2018), copyright 2020, with permission from Elsevier
where E m is the elastic modulus of matrix, V f and E s are the volumetric ratio and
elastic modulus of steel fibers, respectively. For the present test, 0 ≤ V f ≤ 2.5% and
E s = 210 GPa, thus the compressive elastic modulus of UHPCC with different fiber
volumetric ratios are almost identical, which conforms to the above experimental
conclusion. Furthermore, the elastic modulus of C100 plain concrete suggested by
the fib Model Code 2010 (2013) is 47.5 GPa, which is relatively larger than that
obtained in this study.
1.4.2 Direct Tension Test
Figure 1.12 shows the measured tensile stress–strain curves of UHPCC with 2.0%
hooked steel fibers. As can be seen, it is difficult to obtain the average curve based
on these three curves, thus one of three curves which has the highest post-peak stress
is chosen as the representative curve of each batch. Accordingly, Fig. 1.13 shows the
representative tensile stress–strain curves of UHPCC with different steel fiber content
and type. It can be seen that, all the UHPCC specimens behave elastically up to the