

330
10 Residual Axial Capacity of UHPCC-FST Column Under …
Bearing plate
Concrete base
Reaction frame
Steel plate
Pointer displacement
sensor
Rope displacement
sensor
Spherical hinge
Front view
Lateral view
Pointer displacement sensor
Rope displacement sensor
Axial load
Axial load
Concrete base
2000
1000
1000
Spherical hinge
Pointer displacement sensor
Bearing plate
Steel plate
(a)
(b)
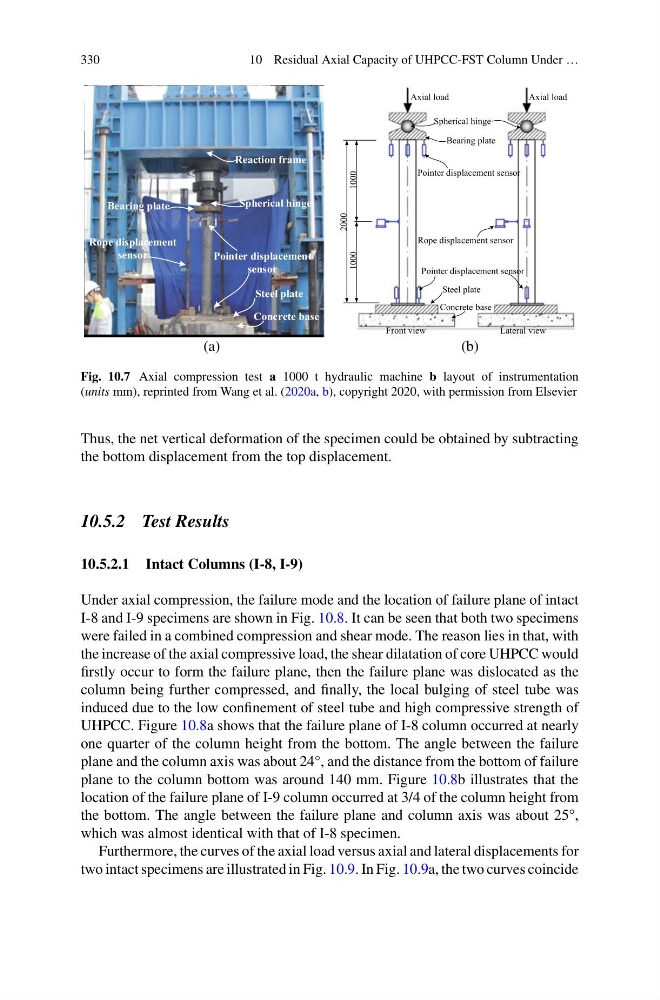
Fig. 10.7 Axial compression test a 1000 t hydraulic machine b layout of instrumentation
(units mm), reprinted from Wang et al. (2020a, b), copyright 2020, with permission from Elsevier
Thus, the net vertical deformation of the specimen could be obtained by subtracting
the bottom displacement from the top displacement.
10.5.2 Test Results
10.5.2.1 Intact Columns (I-8, I-9)
Under axial compression, the failure mode and the location of failure plane of intact
I-8 and I-9 specimens are shown in Fig. 10.8. It can be seen that both two specimens
were failed in a combined compression and shear mode. The reason lies in that, with
the increase of the axial compressive load, the shear dilatation of core UHPCC would
firstly occur to form the failure plane, then the failure plane was dislocated as the
column being further compressed, and finally, the local bulging of steel tube was
induced due to the low confinement of steel tube and high compressive strength of
UHPCC. Figure 10.8a shows that the failure plane of I-8 column occurred at nearly
one quarter of the column height from the bottom. The angle between the failure
plane and the column axis was about 24°, and the distance from the bottom of failure
plane to the column bottom was around 140 mm. Figure 10.8b illustrates that the
location of the failure plane of I-9 column occurred at 3/4 of the column height from
the bottom. The angle between the failure plane and column axis was about 25°,
which was almost identical with that of I-8 specimen.
Furthermore, the curves of the axial load versus axial and lateral displacements for
two intact specimens are illustrated in Fig. 10.9. In Fig. 10.9a, the two curves coincide
10 Residual Axial Capacity of UHPCC-FST Column Under …
Bearing plate
Concrete base
Reaction frame
Steel plate
Pointer displacement
sensor
Rope displacement
sensor
Spherical hinge
Front view
Lateral view
Pointer displacement sensor
Rope displacement sensor
Axial load
Axial load
Concrete base
2000
1000
1000
Spherical hinge
Pointer displacement sensor
Bearing plate
Steel plate
(a)
(b)
Fig. 10.7 Axial compression test a 1000 t hydraulic machine b layout of instrumentation
(units mm), reprinted from Wang et al. (2020a, b), copyright 2020, with permission from Elsevier
Thus, the net vertical deformation of the specimen could be obtained by subtracting
the bottom displacement from the top displacement.
10.5.2 Test Results
10.5.2.1 Intact Columns (I-8, I-9)
Under axial compression, the failure mode and the location of failure plane of intact
I-8 and I-9 specimens are shown in Fig. 10.8. It can be seen that both two specimens
were failed in a combined compression and shear mode. The reason lies in that, with
the increase of the axial compressive load, the shear dilatation of core UHPCC would
firstly occur to form the failure plane, then the failure plane was dislocated as the
column being further compressed, and finally, the local bulging of steel tube was
induced due to the low confinement of steel tube and high compressive strength of
UHPCC. Figure 10.8a shows that the failure plane of I-8 column occurred at nearly
one quarter of the column height from the bottom. The angle between the failure
plane and the column axis was about 24°, and the distance from the bottom of failure
plane to the column bottom was around 140 mm. Figure 10.8b illustrates that the
location of the failure plane of I-9 column occurred at 3/4 of the column height from
the bottom. The angle between the failure plane and column axis was about 25°,
which was almost identical with that of I-8 specimen.
Furthermore, the curves of the axial load versus axial and lateral displacements for
two intact specimens are illustrated in Fig. 10.9. In Fig. 10.9a, the two curves coincide