

9.5 Further Validations
313
0.000
0.005
0.010
0.015
0.020
0.025
0
500
1000
1500
2000
2500
3000
Impact force (kN)
Time (s)
Test data (Wu et al. 2019)
Numerical simulation
0.000
0.005
0.010
0.015
0.020
0.025
0
500
1000
1500
2000
2500
3000
3500
Test data (Wu et al. 2019)
Numerical simulation
Impact force (kN)
Time (s)
0.000
0.005
0.010
0.015
0.020
0.025
0
1000
2000
3000
4000
5000
Test data (Wu et al. 2019)
Numerical simulation
Impact force (kN)
Time (s)
(a)
(b)
(c)
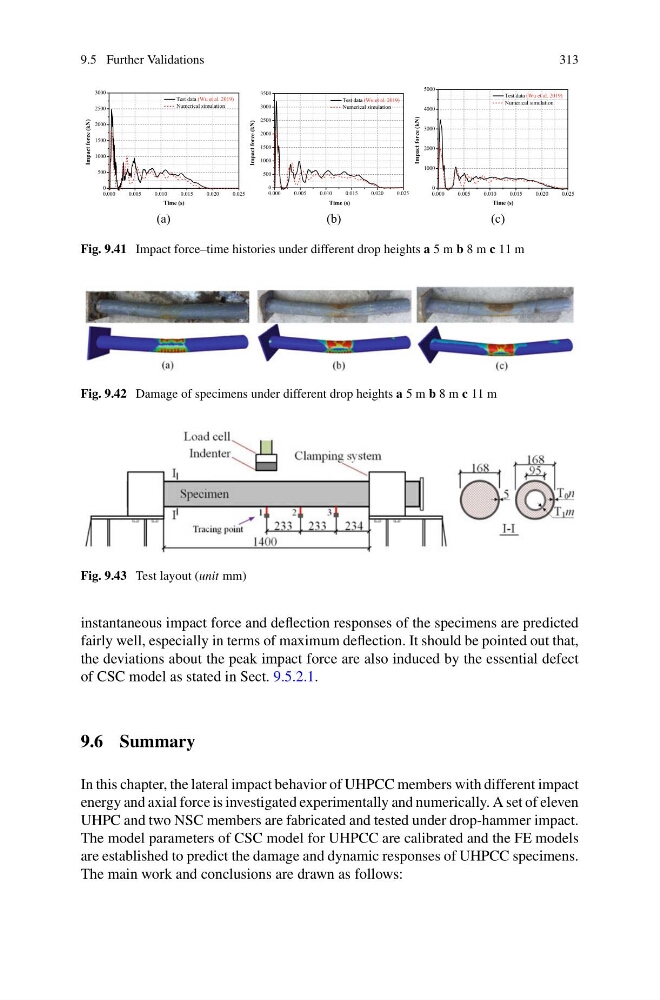
Fig. 9.41 Impact force–time histories under different drop heights a 5 m b 8 m c 11 m
Fig. 9.42 Damage of specimens under different drop heights a 5 m b 8 m c 11 m
Fig. 9.43 Test layout (unit mm)
instantaneous impact force and deflection responses of the specimens are predicted
fairly well, especially in terms of maximum deflection. It should be pointed out that,
the deviations about the peak impact force are also induced by the essential defect
of CSC model as stated in Sect. 9.5.2.1.
9.6 Summary
In this chapter, the lateral impact behavior of UHPCC members with different impact
energy and axial force is investigated experimentally and numerically. A set of eleven
UHPC and two NSC members are fabricated and tested under drop-hammer impact.
The model parameters of CSC model for UHPCC are calibrated and the FE models
are established to predict the damage and dynamic responses of UHPCC specimens.
The main work and conclusions are drawn as follows:
313
0.000
0.005
0.010
0.015
0.020
0.025
0
500
1000
1500
2000
2500
3000
Impact force (kN)
Time (s)
Test data (Wu et al. 2019)
Numerical simulation
0.000
0.005
0.010
0.015
0.020
0.025
0
500
1000
1500
2000
2500
3000
3500
Test data (Wu et al. 2019)
Numerical simulation
Impact force (kN)
Time (s)
0.000
0.005
0.010
0.015
0.020
0.025
0
1000
2000
3000
4000
5000
Test data (Wu et al. 2019)
Numerical simulation
Impact force (kN)
Time (s)
(a)
(b)
(c)
Fig. 9.41 Impact force–time histories under different drop heights a 5 m b 8 m c 11 m
Fig. 9.42 Damage of specimens under different drop heights a 5 m b 8 m c 11 m
Fig. 9.43 Test layout (unit mm)
instantaneous impact force and deflection responses of the specimens are predicted
fairly well, especially in terms of maximum deflection. It should be pointed out that,
the deviations about the peak impact force are also induced by the essential defect
of CSC model as stated in Sect. 9.5.2.1.
9.6 Summary
In this chapter, the lateral impact behavior of UHPCC members with different impact
energy and axial force is investigated experimentally and numerically. A set of eleven
UHPC and two NSC members are fabricated and tested under drop-hammer impact.
The model parameters of CSC model for UHPCC are calibrated and the FE models
are established to predict the damage and dynamic responses of UHPCC specimens.
The main work and conclusions are drawn as follows: