

10
1 Static Mechanical Properties of UHPCC
1.4 Test Results and Discussion
1.4.1 Compression Test
1.4.1.1 Cubic Compression Test
Table 1.4 shows the experimental cubic compressive strengths of UHPCC specimens
with different steel fiber content and type at 28 days. “N100-0”, “S100-0” and “H1000.5” were denoted as the test No., where the capitals “N” “S” and “H” represent no
mixing fiber, micro-straight and hooked steel fibers, “100” the length of specimen,
“0” and “0.5” the steel fiber content. S1 ~ S3 represent the three specimens in each
batch and “—” denotes that the data was not collected or discarded due to large
deviation.
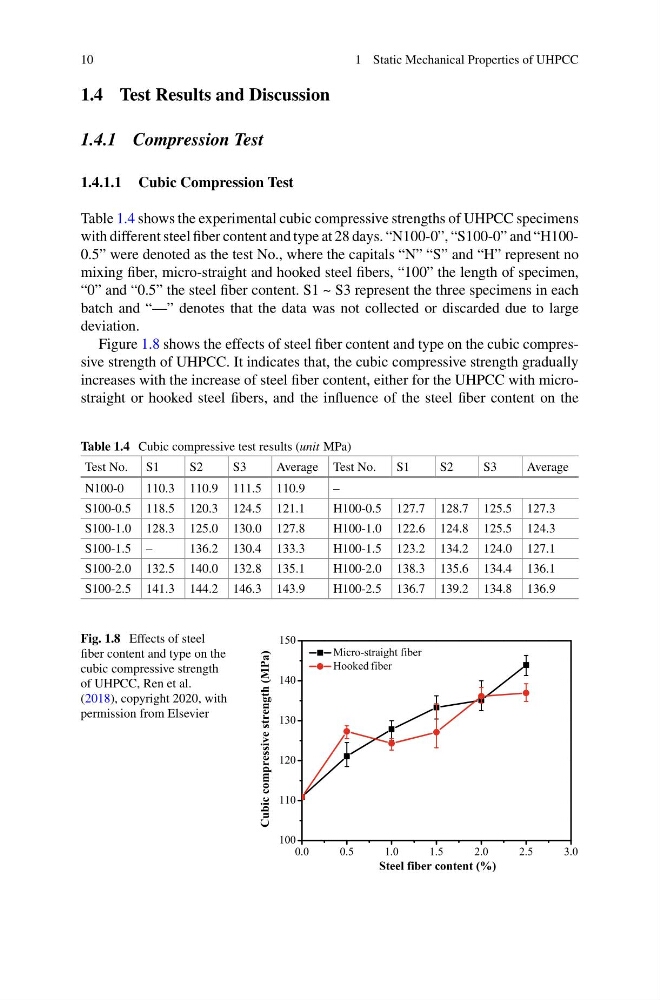
Figure 1.8 shows the effects of steel fiber content and type on the cubic compressive strength of UHPCC. It indicates that, the cubic compressive strength gradually
increases with the increase of steel fiber content, either for the UHPCC with microstraight or hooked steel fibers, and the influence of the steel fiber content on the
Table 1.4 Cubic compressive test results (unit MPa)
Test No. S1
S2
S3
Average Test No.
S1
S2
S3
Average
N100-0
110.3 110.9 111.5 110.9
–
S100-0.5 118.5 120.3 124.5 121.1
H100-0.5 127.7 128.7 125.5 127.3
S100-1.0 128.3 125.0 130.0 127.8
H100-1.0 122.6 124.8 125.5 124.3
S100-1.5 –
136.2 130.4 133.3
H100-1.5 123.2 134.2 124.0 127.1
S100-2.0 132.5 140.0 132.8 135.1
H100-2.0 138.3 135.6 134.4 136.1
S100-2.5 141.3 144.2 146.3 143.9
H100-2.5 136.7 139.2 134.8 136.9
Fig. 1.8 Effects of steel
fiber content and type on the
cubic compressive strength
of UHPCC, Ren et al.
(2018), copyright 2020, with
permission from Elsevier
0.0
0.5
1.0
1.5
2.0
2.5
3.0
100
110
120
130
140
150
Steel fiber content (%)
Cubic compressive strength (MPa)
Micro-straight fiber
Hooked fiber
1 Static Mechanical Properties of UHPCC
1.4 Test Results and Discussion
1.4.1 Compression Test
1.4.1.1 Cubic Compression Test
Table 1.4 shows the experimental cubic compressive strengths of UHPCC specimens
with different steel fiber content and type at 28 days. “N100-0”, “S100-0” and “H1000.5” were denoted as the test No., where the capitals “N” “S” and “H” represent no
mixing fiber, micro-straight and hooked steel fibers, “100” the length of specimen,
“0” and “0.5” the steel fiber content. S1 ~ S3 represent the three specimens in each
batch and “—” denotes that the data was not collected or discarded due to large
deviation.
Figure 1.8 shows the effects of steel fiber content and type on the cubic compressive strength of UHPCC. It indicates that, the cubic compressive strength gradually
increases with the increase of steel fiber content, either for the UHPCC with microstraight or hooked steel fibers, and the influence of the steel fiber content on the
Table 1.4 Cubic compressive test results (unit MPa)
Test No. S1
S2
S3
Average Test No.
S1
S2
S3
Average
N100-0
110.3 110.9 111.5 110.9
–
S100-0.5 118.5 120.3 124.5 121.1
H100-0.5 127.7 128.7 125.5 127.3
S100-1.0 128.3 125.0 130.0 127.8
H100-1.0 122.6 124.8 125.5 124.3
S100-1.5 –
136.2 130.4 133.3
H100-1.5 123.2 134.2 124.0 127.1
S100-2.0 132.5 140.0 132.8 135.1
H100-2.0 138.3 135.6 134.4 136.1
S100-2.5 141.3 144.2 146.3 143.9
H100-2.5 136.7 139.2 134.8 136.9
Fig. 1.8 Effects of steel
fiber content and type on the
cubic compressive strength
of UHPCC, Ren et al.
(2018), copyright 2020, with
permission from Elsevier
0.0
0.5
1.0
1.5
2.0
2.5
3.0
100
110
120
130
140
150
Steel fiber content (%)
Cubic compressive strength (MPa)
Micro-straight fiber
Hooked fiber