

7.3 Impact Test on NP450 Armor Steel/UHPCC and NP500 Armor …
231
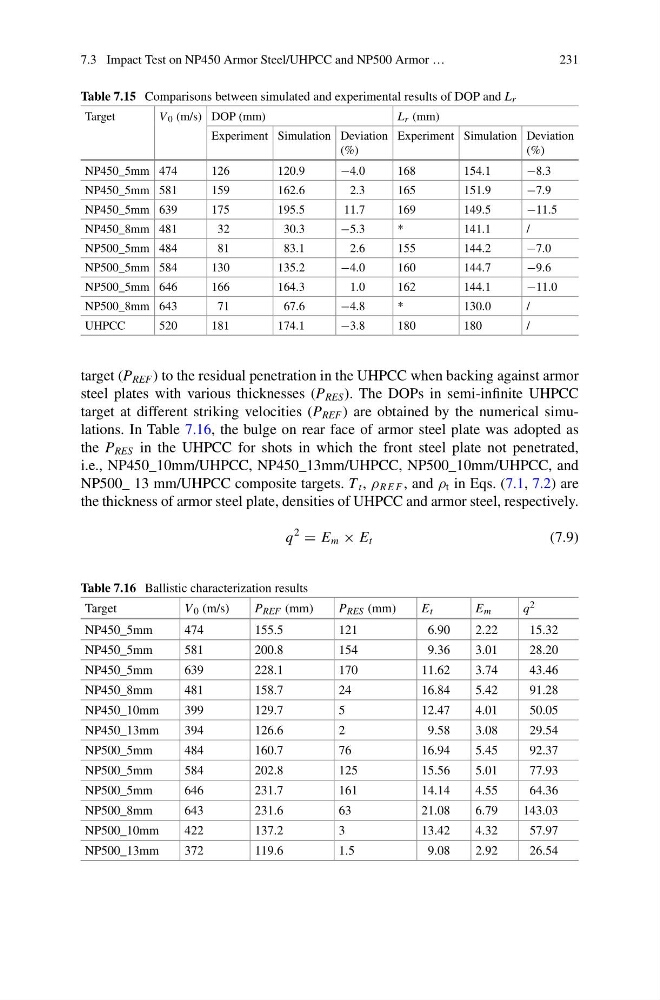
Table 7.15 Comparisons between simulated and experimental results of DOP and L r
Target
V 0 (m/s) DOP (mm)
L r (mm)
Experiment Simulation Deviation
(%)
Experiment Simulation Deviation
(%)
NP450_5mm 474
126
120.9
−4.0
168
154.1
−8.3
NP450_5mm 581
159
162.6
2.3
165
151.9
−7.9
NP450_5mm 639
175
195.5
11.7
169
149.5
−11.5
NP450_8mm 481
32
30.3
−5.3
*
141.1
/
NP500_5mm 484
81
83.1
2.6
155
144.2
−7.0
NP500_5mm 584
130
135.2
−4.0
160
144.7
−9.6
NP500_5mm 646
166
164.3
1.0
162
144.1
−11.0
NP500_8mm 643
71
67.6
−4.8
*
130.0
/
UHPCC
520
181
174.1
−3.8
180
180
/
target (P REF ) to the residual penetration in the UHPCC when backing against armor
steel plates with various thicknesses (P RES ). The DOPs in semi-infinite UHPCC
target at different striking velocities (P REF ) are obtained by the numerical simulations. In Table 7.16, the bulge on rear face of armor steel plate was adopted as
the P RES in the UHPCC for shots in which the front steel plate not penetrated,
i.e., NP450_10mm/UHPCC, NP450_13mm/UHPCC, NP500_10mm/UHPCC, and
NP500_ 13 mm/UHPCC composite targets. T t , ρ R E F , and ρ t in Eqs. (7.1, 7.2) are
the thickness of armor steel plate, densities of UHPCC and armor steel, respectively.
q
2
= E m × E t
(7.9)
Table 7.16 Ballistic characterization results
Target
V 0 (m/s)
P REF (mm)
P RES (mm)
E t
E m
q 2
NP450_5mm
474
155.5
121
6.90
2.22
15.32
NP450_5mm
581
200.8
154
9.36
3.01
28.20
NP450_5mm
639
228.1
170
11.62
3.74
43.46
NP450_8mm
481
158.7
24
16.84
5.42
91.28
NP450_10mm
399
129.7
5
12.47
4.01
50.05
NP450_13mm
394
126.6
2
9.58
3.08
29.54
NP500_5mm
484
160.7
76
16.94
5.45
92.37
NP500_5mm
584
202.8
125
15.56
5.01
77.93
NP500_5mm
646
231.7
161
14.14
4.55
64.36
NP500_8mm
643
231.6
63
21.08
6.79
143.03
NP500_10mm
422
137.2
3
13.42
4.32
57.97
NP500_13mm
372
119.6
1.5
9.08
2.92
26.54
231
Table 7.15 Comparisons between simulated and experimental results of DOP and L r
Target
V 0 (m/s) DOP (mm)
L r (mm)
Experiment Simulation Deviation
(%)
Experiment Simulation Deviation
(%)
NP450_5mm 474
126
120.9
−4.0
168
154.1
−8.3
NP450_5mm 581
159
162.6
2.3
165
151.9
−7.9
NP450_5mm 639
175
195.5
11.7
169
149.5
−11.5
NP450_8mm 481
32
30.3
−5.3
*
141.1
/
NP500_5mm 484
81
83.1
2.6
155
144.2
−7.0
NP500_5mm 584
130
135.2
−4.0
160
144.7
−9.6
NP500_5mm 646
166
164.3
1.0
162
144.1
−11.0
NP500_8mm 643
71
67.6
−4.8
*
130.0
/
UHPCC
520
181
174.1
−3.8
180
180
/
target (P REF ) to the residual penetration in the UHPCC when backing against armor
steel plates with various thicknesses (P RES ). The DOPs in semi-infinite UHPCC
target at different striking velocities (P REF ) are obtained by the numerical simulations. In Table 7.16, the bulge on rear face of armor steel plate was adopted as
the P RES in the UHPCC for shots in which the front steel plate not penetrated,
i.e., NP450_10mm/UHPCC, NP450_13mm/UHPCC, NP500_10mm/UHPCC, and
NP500_ 13 mm/UHPCC composite targets. T t , ρ R E F , and ρ t in Eqs. (7.1, 7.2) are
the thickness of armor steel plate, densities of UHPCC and armor steel, respectively.
q
2
= E m × E t
(7.9)
Table 7.16 Ballistic characterization results
Target
V 0 (m/s)
P REF (mm)
P RES (mm)
E t
E m
q 2
NP450_5mm
474
155.5
121
6.90
2.22
15.32
NP450_5mm
581
200.8
154
9.36
3.01
28.20
NP450_5mm
639
228.1
170
11.62
3.74
43.46
NP450_8mm
481
158.7
24
16.84
5.42
91.28
NP450_10mm
399
129.7
5
12.47
4.01
50.05
NP450_13mm
394
126.6
2
9.58
3.08
29.54
NP500_5mm
484
160.7
76
16.94
5.45
92.37
NP500_5mm
584
202.8
125
15.56
5.01
77.93
NP500_5mm
646
231.7
161
14.14
4.55
64.36
NP500_8mm
643
231.6
63
21.08
6.79
143.03
NP500_10mm
422
137.2
3
13.42
4.32
57.97
NP500_13mm
372
119.6
1.5
9.08
2.92
26.54