

230
7 Impact Resistance of Armor Steel/Ceramic/UHPCC Layered …
(a)
broken
Severe
deformation
(b)
broken
Severe
deformation
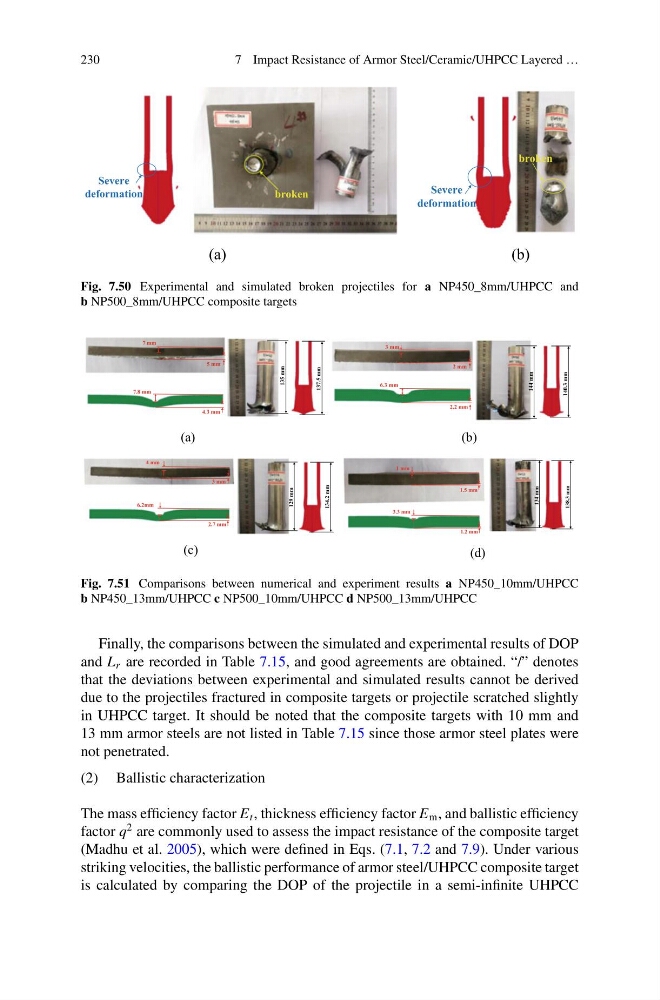
Fig. 7.50 Experimental and simulated broken projectiles for a NP450_8mm/UHPCC and
b NP500_8mm/UHPCC composite targets
(a)
(b)
137.5 mm
7.8 mm
4.3 mm
7 mm
5 mm
135 mm
140.3 mm
3 mm
2 mm
2.2 mm
6.3 mm
144 mm
134.2 mm
4 mm
3 mm
6.2mm
2.7 mm
129 mm
138.3 mm
3.3 mm
1.2 mm
1 mm
1.5 mm
134 mm
(c)
(d)
Fig. 7.51 Comparisons between numerical and experiment results a NP450_10mm/UHPCC
b NP450_13mm/UHPCC c NP500_10mm/UHPCC d NP500_13mm/UHPCC
Finally, the comparisons between the simulated and experimental results of DOP
and L r are recorded in Table 7.15, and good agreements are obtained. “/” denotes
that the deviations between experimental and simulated results cannot be derived
due to the projectiles fractured in composite targets or projectile scratched slightly
in UHPCC target. It should be noted that the composite targets with 10 mm and
13 mm armor steels are not listed in Table 7.15 since those armor steel plates were
not penetrated.
(2) Ballistic characterization
The mass efficiency factor E t , thickness efficiency factor E m , and ballistic efficiency
factor q
2 are commonly used to assess the impact resistance of the composite target
(Madhu et al. 2005), which were defined in Eqs. (7.1, 7.2 and 7.9). Under various
striking velocities, the ballistic performance of armor steel/UHPCC composite target
is calculated by comparing the DOP of the projectile in a semi-infinite UHPCC
7 Impact Resistance of Armor Steel/Ceramic/UHPCC Layered …
(a)
broken
Severe
deformation
(b)
broken
Severe
deformation
Fig. 7.50 Experimental and simulated broken projectiles for a NP450_8mm/UHPCC and
b NP500_8mm/UHPCC composite targets
(a)
(b)
137.5 mm
7.8 mm
4.3 mm
7 mm
5 mm
135 mm
140.3 mm
3 mm
2 mm
2.2 mm
6.3 mm
144 mm
134.2 mm
4 mm
3 mm
6.2mm
2.7 mm
129 mm
138.3 mm
3.3 mm
1.2 mm
1 mm
1.5 mm
134 mm
(c)
(d)
Fig. 7.51 Comparisons between numerical and experiment results a NP450_10mm/UHPCC
b NP450_13mm/UHPCC c NP500_10mm/UHPCC d NP500_13mm/UHPCC
Finally, the comparisons between the simulated and experimental results of DOP
and L r are recorded in Table 7.15, and good agreements are obtained. “/” denotes
that the deviations between experimental and simulated results cannot be derived
due to the projectiles fractured in composite targets or projectile scratched slightly
in UHPCC target. It should be noted that the composite targets with 10 mm and
13 mm armor steels are not listed in Table 7.15 since those armor steel plates were
not penetrated.
(2) Ballistic characterization
The mass efficiency factor E t , thickness efficiency factor E m , and ballistic efficiency
factor q
2 are commonly used to assess the impact resistance of the composite target
(Madhu et al. 2005), which were defined in Eqs. (7.1, 7.2 and 7.9). Under various
striking velocities, the ballistic performance of armor steel/UHPCC composite target
is calculated by comparing the DOP of the projectile in a semi-infinite UHPCC