

228
7 Impact Resistance of Armor Steel/Ceramic/UHPCC Layered …
further obtain the accurate calculation results but increase the computation amount
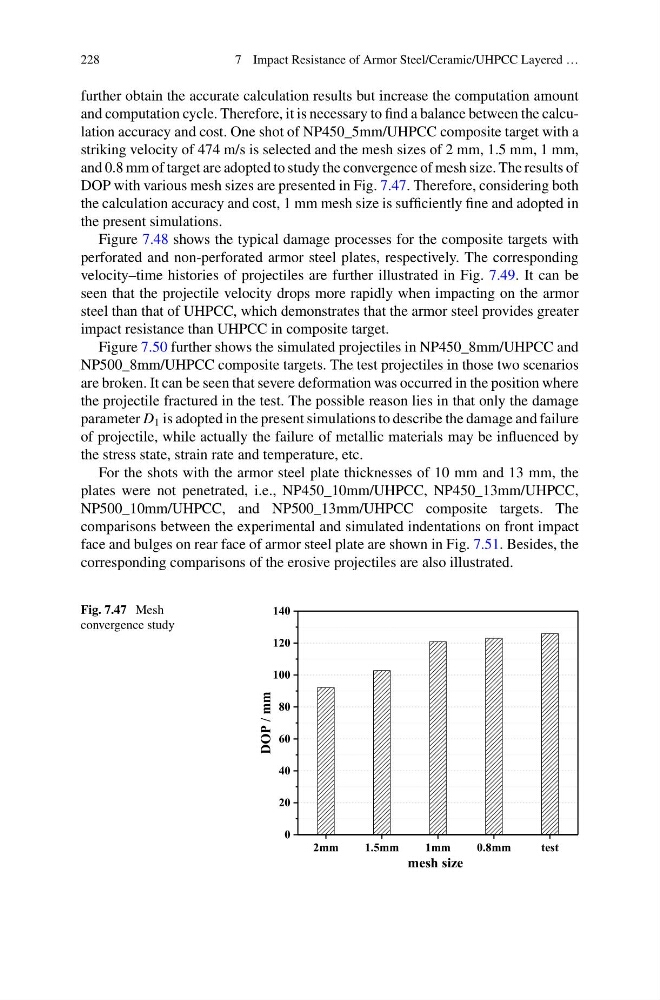
and computation cycle. Therefore, it is necessary to find a balance between the calculation accuracy and cost. One shot of NP450_5mm/UHPCC composite target with a
striking velocity of 474 m/s is selected and the mesh sizes of 2 mm, 1.5 mm, 1 mm,
and 0.8 mm of target are adopted to study the convergence of mesh size. The results of
DOP with various mesh sizes are presented in Fig. 7.47. Therefore, considering both
the calculation accuracy and cost, 1 mm mesh size is sufficiently fine and adopted in
the present simulations.
Figure 7.48 shows the typical damage processes for the composite targets with
perforated and non-perforated armor steel plates, respectively. The corresponding
velocity–time histories of projectiles are further illustrated in Fig. 7.49. It can be
seen that the projectile velocity drops more rapidly when impacting on the armor
steel than that of UHPCC, which demonstrates that the armor steel provides greater
impact resistance than UHPCC in composite target.
Figure 7.50 further shows the simulated projectiles in NP450_8mm/UHPCC and
NP500_8mm/UHPCC composite targets. The test projectiles in those two scenarios
are broken. It can be seen that severe deformation was occurred in the position where
the projectile fractured in the test. The possible reason lies in that only the damage
parameter D 1 is adopted in the present simulations to describe the damage and failure
of projectile, while actually the failure of metallic materials may be influenced by
the stress state, strain rate and temperature, etc.
For the shots with the armor steel plate thicknesses of 10 mm and 13 mm, the
plates were not penetrated, i.e., NP450_10mm/UHPCC, NP450_13mm/UHPCC,
NP500_10mm/UHPCC, and NP500_13mm/UHPCC composite targets. The
comparisons between the experimental and simulated indentations on front impact
face and bulges on rear face of armor steel plate are shown in Fig. 7.51. Besides, the
corresponding comparisons of the erosive projectiles are also illustrated.
Fig. 7.47 Mesh
convergence study
2mm
1.5mm
1mm
0.8mm
test
0
20
40
60
80
100
120
140
DOP / mm
mesh size
7 Impact Resistance of Armor Steel/Ceramic/UHPCC Layered …
further obtain the accurate calculation results but increase the computation amount
and computation cycle. Therefore, it is necessary to find a balance between the calculation accuracy and cost. One shot of NP450_5mm/UHPCC composite target with a
striking velocity of 474 m/s is selected and the mesh sizes of 2 mm, 1.5 mm, 1 mm,
and 0.8 mm of target are adopted to study the convergence of mesh size. The results of
DOP with various mesh sizes are presented in Fig. 7.47. Therefore, considering both
the calculation accuracy and cost, 1 mm mesh size is sufficiently fine and adopted in
the present simulations.
Figure 7.48 shows the typical damage processes for the composite targets with
perforated and non-perforated armor steel plates, respectively. The corresponding
velocity–time histories of projectiles are further illustrated in Fig. 7.49. It can be
seen that the projectile velocity drops more rapidly when impacting on the armor
steel than that of UHPCC, which demonstrates that the armor steel provides greater
impact resistance than UHPCC in composite target.
Figure 7.50 further shows the simulated projectiles in NP450_8mm/UHPCC and
NP500_8mm/UHPCC composite targets. The test projectiles in those two scenarios
are broken. It can be seen that severe deformation was occurred in the position where
the projectile fractured in the test. The possible reason lies in that only the damage
parameter D 1 is adopted in the present simulations to describe the damage and failure
of projectile, while actually the failure of metallic materials may be influenced by
the stress state, strain rate and temperature, etc.
For the shots with the armor steel plate thicknesses of 10 mm and 13 mm, the
plates were not penetrated, i.e., NP450_10mm/UHPCC, NP450_13mm/UHPCC,
NP500_10mm/UHPCC, and NP500_13mm/UHPCC composite targets. The
comparisons between the experimental and simulated indentations on front impact
face and bulges on rear face of armor steel plate are shown in Fig. 7.51. Besides, the
corresponding comparisons of the erosive projectiles are also illustrated.
Fig. 7.47 Mesh
convergence study
2mm
1.5mm
1mm
0.8mm
test
0
20
40
60
80
100
120
140
DOP / mm
mesh size