

224
7 Impact Resistance of Armor Steel/Ceramic/UHPCC Layered …
steels was conducted on a WAW-300B testing machine with the displacement loading
speed of 6.3 mm/min. The corresponding strain rate is 0.001 s
−1 , and the room
temperature is 298 K, i.e., 25 °C, which is taken as the reference strain rate and
temperature. Thus, J–C model given in Eq. (7.3) can be simplified as Eq. (7.4).
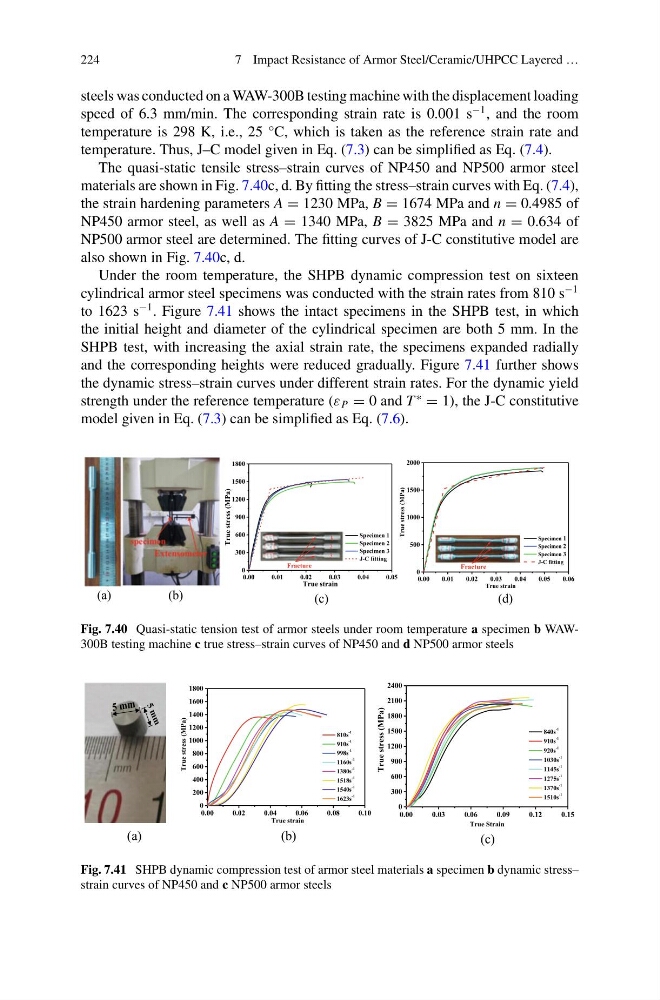
The quasi-static tensile stress–strain curves of NP450 and NP500 armor steel
materials are shown in Fig. 7.40c, d. By fitting the stress–strain curves with Eq. (7.4),
the strain hardening parameters A = 1230 MPa, B = 1674 MPa and n = 0.4985 of
NP450 armor steel, as well as A = 1340 MPa, B = 3825 MPa and n = 0.634 of
NP500 armor steel are determined. The fitting curves of J-C constitutive model are
also shown in Fig. 7.40c, d.
Under the room temperature, the SHPB dynamic compression test on sixteen
cylindrical armor steel specimens was conducted with the strain rates from 810 s
−1
to 1623 s
−1 . Figure 7.41 shows the intact specimens in the SHPB test, in which
the initial height and diameter of the cylindrical specimen are both 5 mm. In the
SHPB test, with increasing the axial strain rate, the specimens expanded radially
and the corresponding heights were reduced gradually. Figure 7.41 further shows
the dynamic stress–strain curves under different strain rates. For the dynamic yield
strength under the reference temperature (ε P = 0 and T
∗
= 1), the J-C constitutive
model given in Eq. (7.3) can be simplified as Eq. (7.6).
0.00
0.01
0.02
0.03
0.04
0.05
0
300
600
900
1200
1500
1800
1
Specimen 1
Specimen 2
Specimen 3
J-C fitting
True stress (MPa)
True strain
Fracture
1
2
3
0.00
0.01
0.02
0.03
0.04
0.05
0.06
0
500
1000
1500
2000
Specimen 1
Specimen 2
Specimen 3
J-C fitting
True stress (MPa)
True strain
Fracture
1
2
3
(a)
(b)
(c)
(d)
Fig. 7.40 Quasi-static tension test of armor steels under room temperature a specimen b WAW300B testing machine c true stress–strain curves of NP450 and d NP500 armor steels
0.00
0.02
0.04
0.06
0.08
0.10
0
200
400
600
800
1000
1200
1400
1600
1800
810s -1
910s -1
998s -1
1160s -1
1380s -1
1518s -1
1540s -1
1623s -1
True stress (MPa)
True strain
0.00
0.03
0.06
0.09
0.12
0.15
0
300
600
900
1200
1500
1800
2100
2400
840s -1
910s -1
920s -1
1030s -1
1145s -1
1275s -1
1370s -1
1510s -1
True stress (MPa)
True Strain
(a)
(b)
(c)
Fig. 7.41 SHPB dynamic compression test of armor steel materials a specimen b dynamic stress–
strain curves of NP450 and c NP500 armor steels
7 Impact Resistance of Armor Steel/Ceramic/UHPCC Layered …
steels was conducted on a WAW-300B testing machine with the displacement loading
speed of 6.3 mm/min. The corresponding strain rate is 0.001 s
−1 , and the room
temperature is 298 K, i.e., 25 °C, which is taken as the reference strain rate and
temperature. Thus, J–C model given in Eq. (7.3) can be simplified as Eq. (7.4).
The quasi-static tensile stress–strain curves of NP450 and NP500 armor steel
materials are shown in Fig. 7.40c, d. By fitting the stress–strain curves with Eq. (7.4),
the strain hardening parameters A = 1230 MPa, B = 1674 MPa and n = 0.4985 of
NP450 armor steel, as well as A = 1340 MPa, B = 3825 MPa and n = 0.634 of
NP500 armor steel are determined. The fitting curves of J-C constitutive model are
also shown in Fig. 7.40c, d.
Under the room temperature, the SHPB dynamic compression test on sixteen
cylindrical armor steel specimens was conducted with the strain rates from 810 s
−1
to 1623 s
−1 . Figure 7.41 shows the intact specimens in the SHPB test, in which
the initial height and diameter of the cylindrical specimen are both 5 mm. In the
SHPB test, with increasing the axial strain rate, the specimens expanded radially
and the corresponding heights were reduced gradually. Figure 7.41 further shows
the dynamic stress–strain curves under different strain rates. For the dynamic yield
strength under the reference temperature (ε P = 0 and T
∗
= 1), the J-C constitutive
model given in Eq. (7.3) can be simplified as Eq. (7.6).
0.00
0.01
0.02
0.03
0.04
0.05
0
300
600
900
1200
1500
1800
1
Specimen 1
Specimen 2
Specimen 3
J-C fitting
True stress (MPa)
True strain
Fracture
1
2
3
0.00
0.01
0.02
0.03
0.04
0.05
0.06
0
500
1000
1500
2000
Specimen 1
Specimen 2
Specimen 3
J-C fitting
True stress (MPa)
True strain
Fracture
1
2
3
(a)
(b)
(c)
(d)
Fig. 7.40 Quasi-static tension test of armor steels under room temperature a specimen b WAW300B testing machine c true stress–strain curves of NP450 and d NP500 armor steels
0.00
0.02
0.04
0.06
0.08
0.10
0
200
400
600
800
1000
1200
1400
1600
1800
810s -1
910s -1
998s -1
1160s -1
1380s -1
1518s -1
1540s -1
1623s -1
True stress (MPa)
True strain
0.00
0.03
0.06
0.09
0.12
0.15
0
300
600
900
1200
1500
1800
2100
2400
840s -1
910s -1
920s -1
1030s -1
1145s -1
1275s -1
1370s -1
1510s -1
True stress (MPa)
True Strain
(a)
(b)
(c)
Fig. 7.41 SHPB dynamic compression test of armor steel materials a specimen b dynamic stress–
strain curves of NP450 and c NP500 armor steels