

5.4 Numerical Simulations Based on 3D Mesoscopic Concrete Model
151
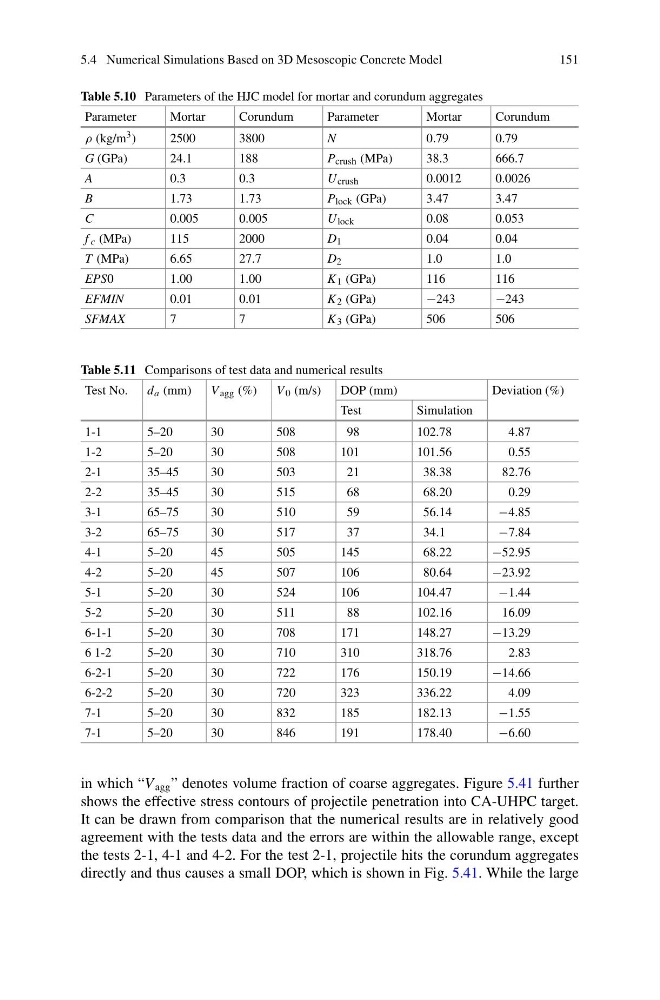
Table 5.10 Parameters of the HJC model for mortar and corundum aggregates
Parameter
Mortar
Corundum
Parameter
Mortar
Corundum
ρ (kg/m 3 )
2500
3800
N
0.79
0.79
G (GPa)
24.1
188
P crush (MPa)
38.3
666.7
A
0.3
0.3
U crush
0.0012
0.0026
B
1.73
1.73
P lock (GPa)
3.47
3.47
C
0.005
0.005
U lock
0.08
0.053
f c (MPa)
115
2000
D 1
0.04
0.04
T (MPa)
6.65
27.7
D 2
1.0
1.0
EPS0
1.00
1.00
K 1 (GPa)
116
116
EFMIN
0.01
0.01
K 2 (GPa)
−243
−243
SFMAX
7
7
K 3 (GPa)
506
506
Table 5.11 Comparisons of test data and numerical results
Test No.
d a (mm)
V agg (%)
V 0 (m/s)
DOP (mm)
Deviation (%)
Test
Simulation
1-1
5–20
30
508
98
102.78
4.87
1-2
5–20
30
508
101
101.56
0.55
2-1
35–45
30
503
21
38.38
82.76
2-2
35–45
30
515
68
68.20
0.29
3-1
65–75
30
510
59
56.14
−4.85
3-2
65–75
30
517
37
34.1
−7.84
4-1
5–20
45
505
145
68.22
−52.95
4-2
5–20
45
507
106
80.64
−23.92
5-1
5–20
30
524
106
104.47
−1.44
5-2
5–20
30
511
88
102.16
16.09
6-1-1
5–20
30
708
171
148.27
−13.29
6 1-2
5–20
30
710
310
318.76
2.83
6-2-1
5–20
30
722
176
150.19
−14.66
6-2-2
5–20
30
720
323
336.22
4.09
7-1
5–20
30
832
185
182.13
−1.55
7-1
5–20
30
846
191
178.40
−6.60
in which “V agg ” denotes volume fraction of coarse aggregates. Figure 5.41 further
shows the effective stress contours of projectile penetration into CA-UHPC target.
It can be drawn from comparison that the numerical results are in relatively good
agreement with the tests data and the errors are within the allowable range, except
the tests 2-1, 4-1 and 4-2. For the test 2-1, projectile hits the corundum aggregates
directly and thus causes a small DOP, which is shown in Fig. 5.41. While the large
151
Table 5.10 Parameters of the HJC model for mortar and corundum aggregates
Parameter
Mortar
Corundum
Parameter
Mortar
Corundum
ρ (kg/m 3 )
2500
3800
N
0.79
0.79
G (GPa)
24.1
188
P crush (MPa)
38.3
666.7
A
0.3
0.3
U crush
0.0012
0.0026
B
1.73
1.73
P lock (GPa)
3.47
3.47
C
0.005
0.005
U lock
0.08
0.053
f c (MPa)
115
2000
D 1
0.04
0.04
T (MPa)
6.65
27.7
D 2
1.0
1.0
EPS0
1.00
1.00
K 1 (GPa)
116
116
EFMIN
0.01
0.01
K 2 (GPa)
−243
−243
SFMAX
7
7
K 3 (GPa)
506
506
Table 5.11 Comparisons of test data and numerical results
Test No.
d a (mm)
V agg (%)
V 0 (m/s)
DOP (mm)
Deviation (%)
Test
Simulation
1-1
5–20
30
508
98
102.78
4.87
1-2
5–20
30
508
101
101.56
0.55
2-1
35–45
30
503
21
38.38
82.76
2-2
35–45
30
515
68
68.20
0.29
3-1
65–75
30
510
59
56.14
−4.85
3-2
65–75
30
517
37
34.1
−7.84
4-1
5–20
45
505
145
68.22
−52.95
4-2
5–20
45
507
106
80.64
−23.92
5-1
5–20
30
524
106
104.47
−1.44
5-2
5–20
30
511
88
102.16
16.09
6-1-1
5–20
30
708
171
148.27
−13.29
6 1-2
5–20
30
710
310
318.76
2.83
6-2-1
5–20
30
722
176
150.19
−14.66
6-2-2
5–20
30
720
323
336.22
4.09
7-1
5–20
30
832
185
182.13
−1.55
7-1
5–20
30
846
191
178.40
−6.60
in which “V agg ” denotes volume fraction of coarse aggregates. Figure 5.41 further
shows the effective stress contours of projectile penetration into CA-UHPC target.
It can be drawn from comparison that the numerical results are in relatively good
agreement with the tests data and the errors are within the allowable range, except
the tests 2-1, 4-1 and 4-2. For the test 2-1, projectile hits the corundum aggregates
directly and thus causes a small DOP, which is shown in Fig. 5.41. While the large