

5.3 Corundum Aggregated UHPCC Target
129
Table 5.5 (continued)
Target
No.
Projectile mass
Projectile length
Projectile
M 0 (g)
M r (g) Mass
loss
L 0 (mm) L r (mm) Length
loss
7-1
341.2
312.7
8.4% 151.0
139.2
7.8%
Embed and
severely
abraded
7-2
341.2
315.2
7.6% 150.9
136.4
9.6%
Embed and
severely
abraded
HSC
1-1
341.2
336.1
1.5% 151.2
149.2
1.3%
Bounced
and nearly
intact
1-2
341.2
336.3
1.4% 150.8
150.3
0.3%
Bounced
and nearly
intact
based on Table 5.4, the influences of strength (hardness), size and the volumetric ratio
of coarse aggregate as well as the striking velocity on the DOP were discussed.
(1) Influences of the coarse aggregate strength (hardness)
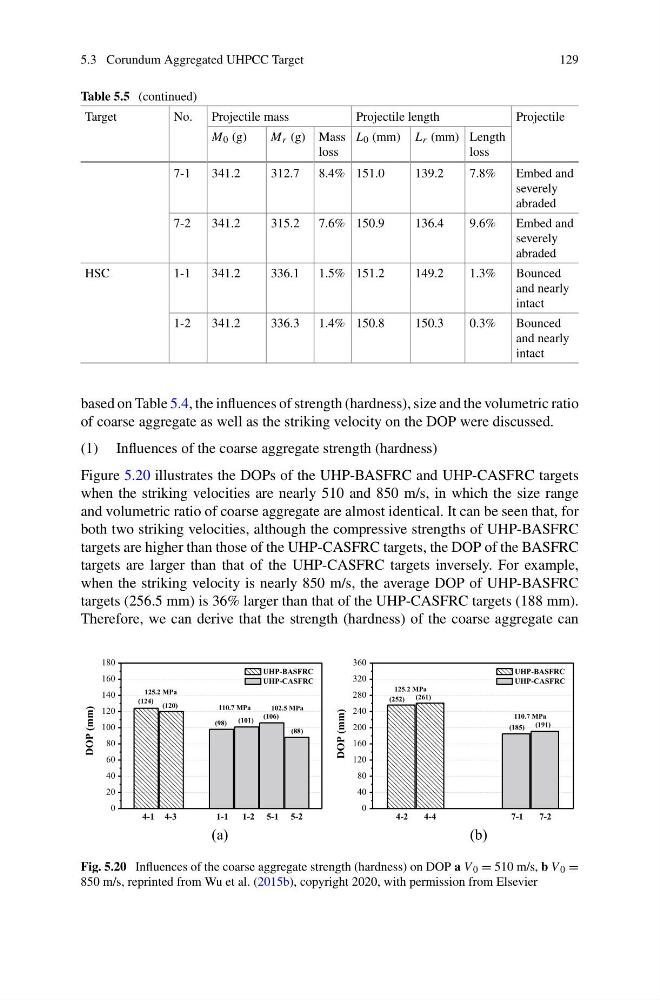
Figure 5.20 illustrates the DOPs of the UHP-BASFRC and UHP-CASFRC targets
when the striking velocities are nearly 510 and 850 m/s, in which the size range
and volumetric ratio of coarse aggregate are almost identical. It can be seen that, for
both two striking velocities, although the compressive strengths of UHP-BASFRC
targets are higher than those of the UHP-CASFRC targets, the DOP of the BASFRC
targets are larger than that of the UHP-CASFRC targets inversely. For example,
when the striking velocity is nearly 850 m/s, the average DOP of UHP-BASFRC
targets (256.5 mm) is 36% larger than that of the UHP-CASFRC targets (188 mm).
Therefore, we can derive that the strength (hardness) of the coarse aggregate can
0
20
40
60
80
100
120
140
160
180
102.5 MPa
110.7 MPa
125.2 MPa
(88)
(106)
(101)
(98)
(120)
(124)
DOP (mm)
UHP-BASFRC
UHP-CASFRC
0
40
80
120
160
200
240
280
320
360
4-1 4-3
1-1
1-2 5-1 5-2
4-2
4-4
7-1
7-2
110.7 MPa
125.2 MPa
(191)
(185)
(261)
(252)
DOP (mm)
UHP-BASFRC
UHP-CASFRC
(a)
(b)
Fig. 5.20 Influences of the coarse aggregate strength (hardness) on DOP a V 0 = 510 m/s, b V 0 =
850 m/s, reprinted from Wu et al. (2015b), copyright 2020, with permission from Elsevier
129
Table 5.5 (continued)
Target
No.
Projectile mass
Projectile length
Projectile
M 0 (g)
M r (g) Mass
loss
L 0 (mm) L r (mm) Length
loss
7-1
341.2
312.7
8.4% 151.0
139.2
7.8%
Embed and
severely
abraded
7-2
341.2
315.2
7.6% 150.9
136.4
9.6%
Embed and
severely
abraded
HSC
1-1
341.2
336.1
1.5% 151.2
149.2
1.3%
Bounced
and nearly
intact
1-2
341.2
336.3
1.4% 150.8
150.3
0.3%
Bounced
and nearly
intact
based on Table 5.4, the influences of strength (hardness), size and the volumetric ratio
of coarse aggregate as well as the striking velocity on the DOP were discussed.
(1) Influences of the coarse aggregate strength (hardness)
Figure 5.20 illustrates the DOPs of the UHP-BASFRC and UHP-CASFRC targets
when the striking velocities are nearly 510 and 850 m/s, in which the size range
and volumetric ratio of coarse aggregate are almost identical. It can be seen that, for
both two striking velocities, although the compressive strengths of UHP-BASFRC
targets are higher than those of the UHP-CASFRC targets, the DOP of the BASFRC
targets are larger than that of the UHP-CASFRC targets inversely. For example,
when the striking velocity is nearly 850 m/s, the average DOP of UHP-BASFRC
targets (256.5 mm) is 36% larger than that of the UHP-CASFRC targets (188 mm).
Therefore, we can derive that the strength (hardness) of the coarse aggregate can
0
20
40
60
80
100
120
140
160
180
102.5 MPa
110.7 MPa
125.2 MPa
(88)
(106)
(101)
(98)
(120)
(124)
DOP (mm)
UHP-BASFRC
UHP-CASFRC
0
40
80
120
160
200
240
280
320
360
4-1 4-3
1-1
1-2 5-1 5-2
4-2
4-4
7-1
7-2
110.7 MPa
125.2 MPa
(191)
(185)
(261)
(252)
DOP (mm)
UHP-BASFRC
UHP-CASFRC
(a)
(b)
Fig. 5.20 Influences of the coarse aggregate strength (hardness) on DOP a V 0 = 510 m/s, b V 0 =
850 m/s, reprinted from Wu et al. (2015b), copyright 2020, with permission from Elsevier