

80
4 Triaxial Compressive Behavior of UHPCC …
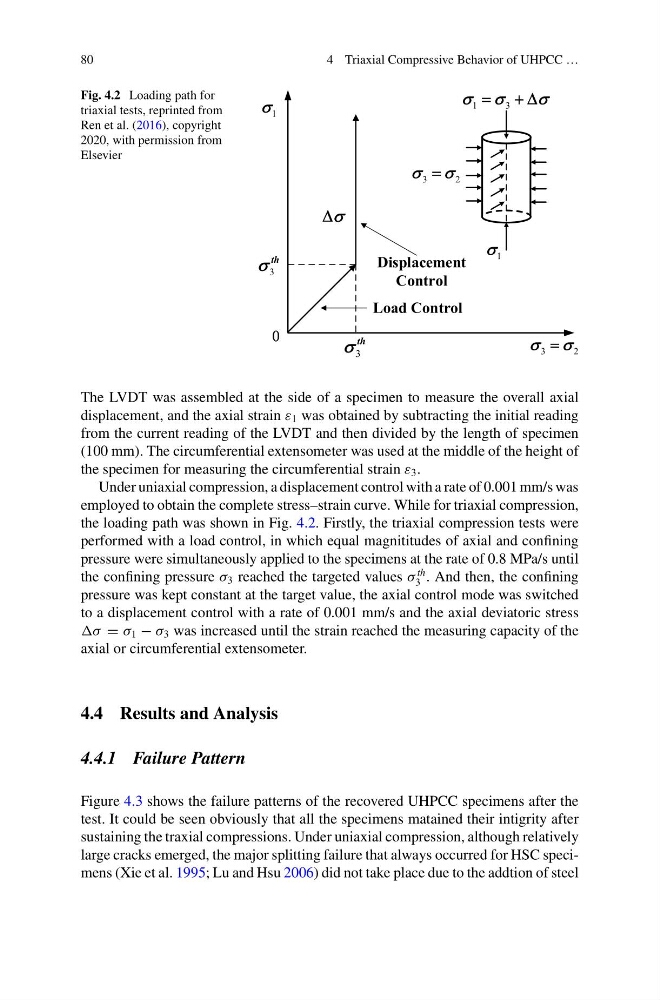
Fig. 4.2 Loading path for
triaxial tests, reprinted from
Ren et al. (2016), copyright
2020, with permission from
Elsevier
The LVDT was assembled at the side of a specimen to measure the overall axial
displacement, and the axial strain ε 1 was obtained by subtracting the initial reading
from the current reading of the LVDT and then divided by the length of specimen
(100 mm). The circumferential extensometer was used at the middle of the height of
the specimen for measuring the circumferential strain ε 3 .
Under uniaxial compression, a displacement control with a rate of 0.001 mm/s was
employed to obtain the complete stress–strain curve. While for triaxial compression,
the loading path was shown in Fig. 4.2. Firstly, the triaxial compression tests were
performed with a load control, in which equal magnititudes of axial and confining
pressure were simultaneously applied to the specimens at the rate of 0.8 MPa/s until
the confining pressure σ 3 reached the targeted values σ
th
3 . And then, the confining
pressure was kept constant at the target value, the axial control mode was switched
to a displacement control with a rate of 0.001 mm/s and the axial deviatoric stress
= σ 1 − σ 3 was increased until the strain reached the measuring capacity of the
axial or circumferential extensometer.
4.4 Results and Analysis
4.4.1 Failure Pattern
Figure 4.3 shows the failure patterns of the recovered UHPCC specimens after the
test. It could be seen obviously that all the specimens matained their intigrity after
sustaining the traxial compressions. Under uniaxial compression, although relatively
large cracks emerged, the major splitting failure that always occurred for HSC specimens (Xie et al. 1995; Lu and Hsu 2006) did not take place due to the addtion of steel
4 Triaxial Compressive Behavior of UHPCC …
Fig. 4.2 Loading path for
triaxial tests, reprinted from
Ren et al. (2016), copyright
2020, with permission from
Elsevier
The LVDT was assembled at the side of a specimen to measure the overall axial
displacement, and the axial strain ε 1 was obtained by subtracting the initial reading
from the current reading of the LVDT and then divided by the length of specimen
(100 mm). The circumferential extensometer was used at the middle of the height of
the specimen for measuring the circumferential strain ε 3 .
Under uniaxial compression, a displacement control with a rate of 0.001 mm/s was
employed to obtain the complete stress–strain curve. While for triaxial compression,
the loading path was shown in Fig. 4.2. Firstly, the triaxial compression tests were
performed with a load control, in which equal magnititudes of axial and confining
pressure were simultaneously applied to the specimens at the rate of 0.8 MPa/s until
the confining pressure σ 3 reached the targeted values σ
th
3 . And then, the confining
pressure was kept constant at the target value, the axial control mode was switched
to a displacement control with a rate of 0.001 mm/s and the axial deviatoric stress
= σ 1 − σ 3 was increased until the strain reached the measuring capacity of the
axial or circumferential extensometer.
4.4 Results and Analysis
4.4.1 Failure Pattern
Figure 4.3 shows the failure patterns of the recovered UHPCC specimens after the
test. It could be seen obviously that all the specimens matained their intigrity after
sustaining the traxial compressions. Under uniaxial compression, although relatively
large cracks emerged, the major splitting failure that always occurred for HSC specimens (Xie et al. 1995; Lu and Hsu 2006) did not take place due to the addtion of steel