

9.7 Size-Dependent Euler-Bernoulli Beams with Topologically Optimized Microstructure 395
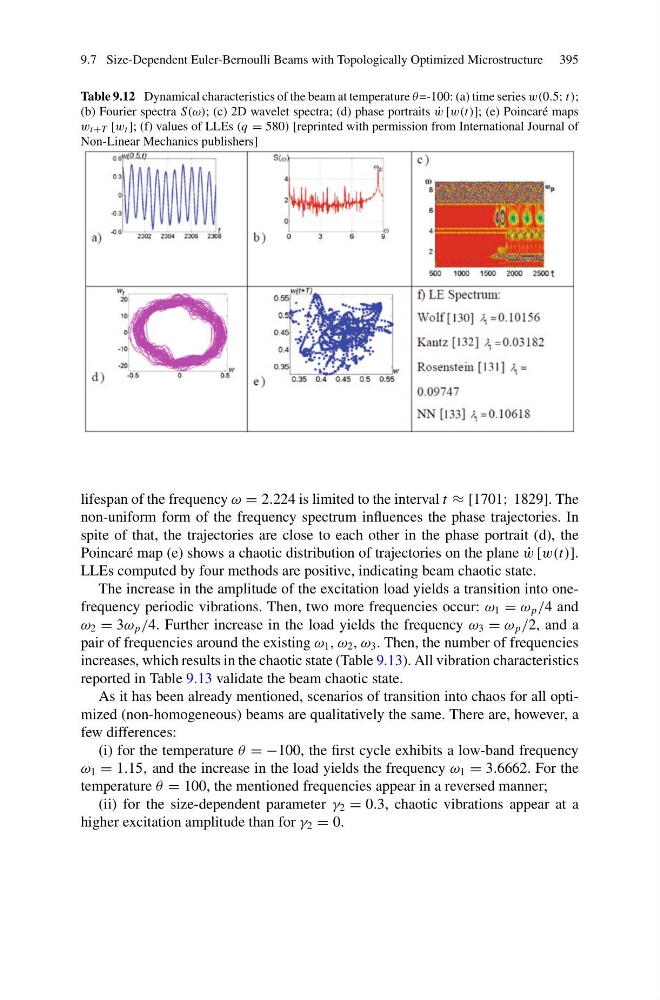
Table 9.12 Dynamical characteristics of the beam at temperature θ=-100: (a) time series w(0.5; t);
(b) Fourier spectra S(ω); (c) 2D wavelet spectra; (d) phase portraits ˙
w [w(t)]; (e) Poincaré maps
w t+T [w t ]; (f) values of LLEs (q = 580) [reprinted with permission from International Journal of
Non-Linear Mechanics publishers]
lifespan of the frequency ω = 2.224 is limited to the interval t ≈ [1701; 1829]. The
non-uniform form of the frequency spectrum influences the phase trajectories. In
spite of that, the trajectories are close to each other in the phase portrait (d), the
Poincaré map (e) shows a chaotic distribution of trajectories on the plane ˙
w [w(t)].
LLEs computed by four methods are positive, indicating beam chaotic state.
The increase in the amplitude of the excitation load yields a transition into onefrequency periodic vibrations. Then, two more frequencies occur: ω 1 = ω p /4 and
ω 2 = 3ω p /4. Further increase in the load yields the frequency ω 3 = ω p /2, and a
pair of frequencies around the existing ω 1 , ω 2 , ω 3 . Then, the number of frequencies
increases, which results in the chaotic state (Table 9.13). All vibration characteristics
reported in Table 9.13 validate the beam chaotic state.
As it has been already mentioned, scenarios of transition into chaos for all optimized (non-homogeneous) beams are qualitatively the same. There are, however, a
few differences:
(i) for the temperature θ = −100, the first cycle exhibits a low-band frequency
ω 1 = 1.15, and the increase in the load yields the frequency ω 1 = 3.6662. For the
temperature θ = 100, the mentioned frequencies appear in a reversed manner;
(ii) for the size-dependent parameter γ 2 = 0.3, chaotic vibrations appear at a
higher excitation amplitude than for γ 2 = 0.
Table 9.12 Dynamical characteristics of the beam at temperature θ=-100: (a) time series w(0.5; t);
(b) Fourier spectra S(ω); (c) 2D wavelet spectra; (d) phase portraits ˙
w [w(t)]; (e) Poincaré maps
w t+T [w t ]; (f) values of LLEs (q = 580) [reprinted with permission from International Journal of
Non-Linear Mechanics publishers]
lifespan of the frequency ω = 2.224 is limited to the interval t ≈ [1701; 1829]. The
non-uniform form of the frequency spectrum influences the phase trajectories. In
spite of that, the trajectories are close to each other in the phase portrait (d), the
Poincaré map (e) shows a chaotic distribution of trajectories on the plane ˙
w [w(t)].
LLEs computed by four methods are positive, indicating beam chaotic state.
The increase in the amplitude of the excitation load yields a transition into onefrequency periodic vibrations. Then, two more frequencies occur: ω 1 = ω p /4 and
ω 2 = 3ω p /4. Further increase in the load yields the frequency ω 3 = ω p /2, and a
pair of frequencies around the existing ω 1 , ω 2 , ω 3 . Then, the number of frequencies
increases, which results in the chaotic state (Table 9.13). All vibration characteristics
reported in Table 9.13 validate the beam chaotic state.
As it has been already mentioned, scenarios of transition into chaos for all optimized (non-homogeneous) beams are qualitatively the same. There are, however, a
few differences:
(i) for the temperature θ = −100, the first cycle exhibits a low-band frequency
ω 1 = 1.15, and the increase in the load yields the frequency ω 1 = 3.6662. For the
temperature θ = 100, the mentioned frequencies appear in a reversed manner;
(ii) for the size-dependent parameter γ 2 = 0.3, chaotic vibrations appear at a
higher excitation amplitude than for γ 2 = 0.