

260
7 Mathematical Models of Functionally Graded Beams in Temperature Field
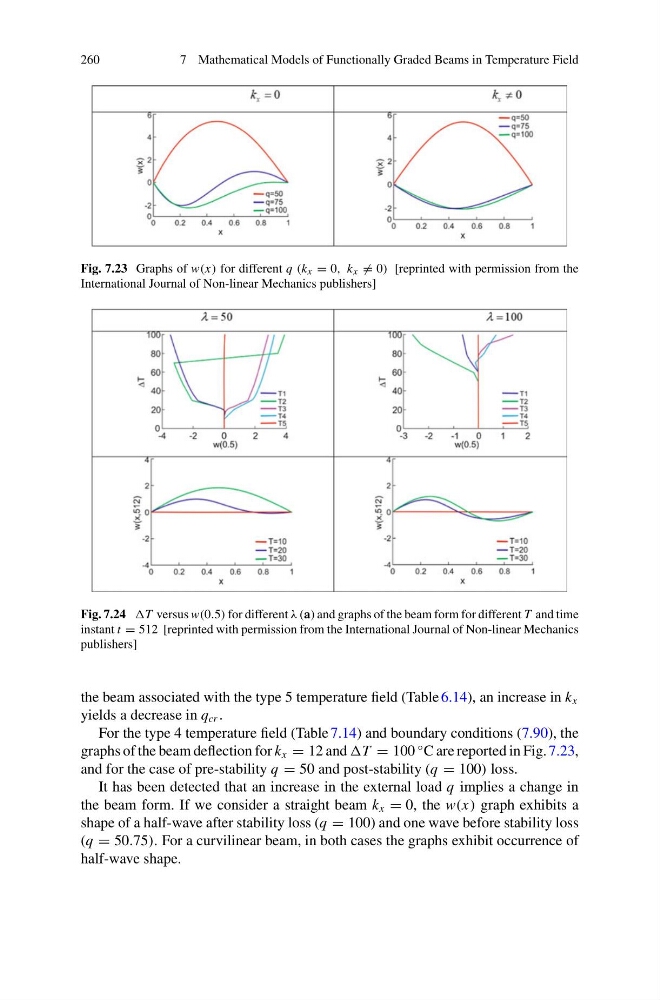
Fig. 7.23 Graphs of w(x) for different q (k x = 0, k x = 0) [reprinted with permission from the
International Journal of Non-linear Mechanics publishers]
Fig. 7.24 T versus w(0.5) for different λ (a) and graphs of the beam form for different T and time
instant t = 512 [reprinted with permission from the International Journal of Non-linear Mechanics
publishers]
the beam associated with the type 5 temperature field (Table 6.14), an increase in k x
yields a decrease in q cr .
For the type 4 temperature field (Table 7.14) and boundary conditions (7.90), the
graphs of the beam deflection for k x = 12 and T = 100
◦ C are reported in Fig. 7.23,
and for the case of pre-stability q = 50 and post-stability (q = 100) loss.
It has been detected that an increase in the external load q implies a change in
the beam form. If we consider a straight beam k x = 0, the w(x) graph exhibits a
shape of a half-wave after stability loss (q = 100) and one wave before stability loss
(q = 50.75). For a curvilinear beam, in both cases the graphs exhibit occurrence of
half-wave shape.
7 Mathematical Models of Functionally Graded Beams in Temperature Field
Fig. 7.23 Graphs of w(x) for different q (k x = 0, k x = 0) [reprinted with permission from the
International Journal of Non-linear Mechanics publishers]
Fig. 7.24 T versus w(0.5) for different λ (a) and graphs of the beam form for different T and time
instant t = 512 [reprinted with permission from the International Journal of Non-linear Mechanics
publishers]
the beam associated with the type 5 temperature field (Table 6.14), an increase in k x
yields a decrease in q cr .
For the type 4 temperature field (Table 7.14) and boundary conditions (7.90), the
graphs of the beam deflection for k x = 12 and T = 100
◦ C are reported in Fig. 7.23,
and for the case of pre-stability q = 50 and post-stability (q = 100) loss.
It has been detected that an increase in the external load q implies a change in
the beam form. If we consider a straight beam k x = 0, the w(x) graph exhibits a
shape of a half-wave after stability loss (q = 100) and one wave before stability loss
(q = 50.75). For a curvilinear beam, in both cases the graphs exhibit occurrence of
half-wave shape.