

6.7 Charts of Vibration Characters Verusus Parameters
191
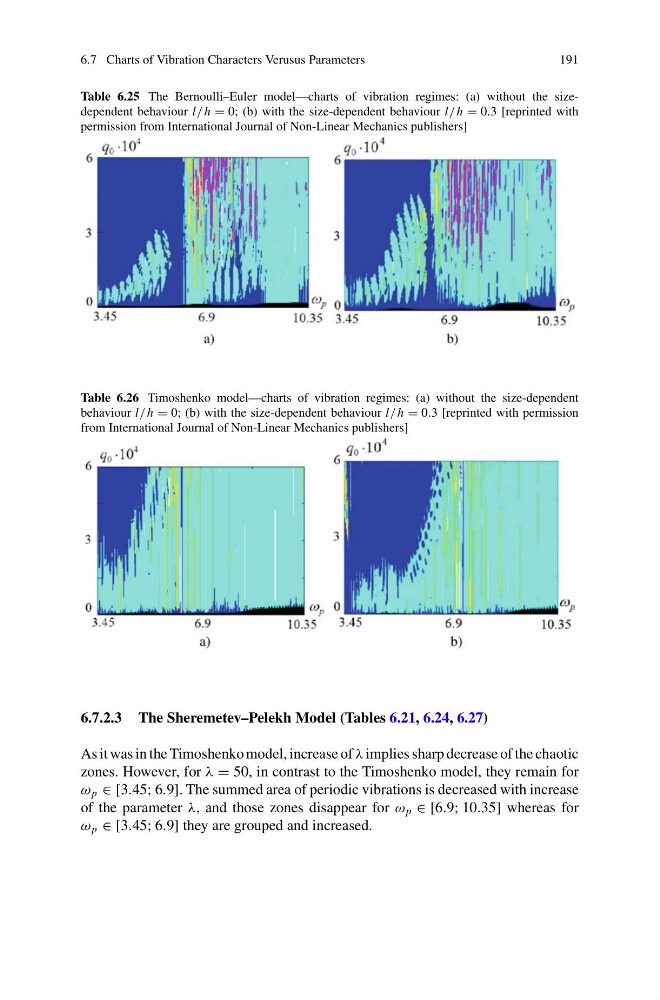
Table 6.25 The Bernoulli–Euler model—charts of vibration regimes: (a) without the sizedependent behaviour l/ h = 0; (b) with the size-dependent behaviour l/ h = 0.3 [reprinted with
permission from International Journal of Non-Linear Mechanics publishers]
Table 6.26 Timoshenko model—charts of vibration regimes: (a) without the size-dependent
behaviour l/ h = 0; (b) with the size-dependent behaviour l/ h = 0.3 [reprinted with permission
from International Journal of Non-Linear Mechanics publishers]
6.7.2.3 The Sheremetev–Pelekh Model (Tables 6.21, 6.24, 6.27)
As it was in the Timoshenko model, increase of λ implies sharp decrease of the chaotic
zones. However, for λ = 50, in contrast to the Timoshenko model, they remain for
ω p ∈ [3.45; 6.9]. The summed area of periodic vibrations is decreased with increase
of the parameter λ, and those zones disappear for ω p ∈ [6.9; 10.35] whereas for
ω p ∈ [3.45; 6.9] they are grouped and increased.
191
Table 6.25 The Bernoulli–Euler model—charts of vibration regimes: (a) without the sizedependent behaviour l/ h = 0; (b) with the size-dependent behaviour l/ h = 0.3 [reprinted with
permission from International Journal of Non-Linear Mechanics publishers]
Table 6.26 Timoshenko model—charts of vibration regimes: (a) without the size-dependent
behaviour l/ h = 0; (b) with the size-dependent behaviour l/ h = 0.3 [reprinted with permission
from International Journal of Non-Linear Mechanics publishers]
6.7.2.3 The Sheremetev–Pelekh Model (Tables 6.21, 6.24, 6.27)
As it was in the Timoshenko model, increase of λ implies sharp decrease of the chaotic
zones. However, for λ = 50, in contrast to the Timoshenko model, they remain for
ω p ∈ [3.45; 6.9]. The summed area of periodic vibrations is decreased with increase
of the parameter λ, and those zones disappear for ω p ∈ [6.9; 10.35] whereas for
ω p ∈ [3.45; 6.9] they are grouped and increased.