

4.5 Numerical Experiment
103
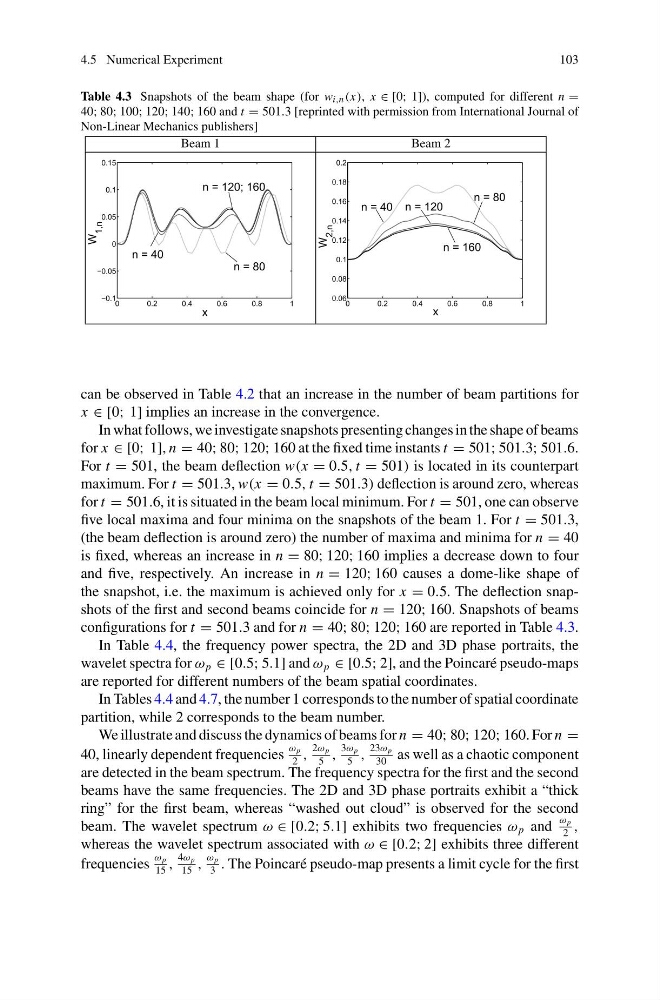
Table 4.3 Snapshots of the beam shape (for w i,n (x), x ∈ [0; 1]), computed for different n =
40; 80; 100; 120; 140; 160 and t = 501.3 [reprinted with permission from International Journal of
Non-Linear Mechanics publishers]
can be observed in Table 4.2 that an increase in the number of beam partitions for
x ∈ [0; 1] implies an increase in the convergence.
In what follows, we investigate snapshots presenting changes in the shape of beams
for x ∈ [0; 1], n = 40; 80; 120; 160 at the fixed time instants t = 501; 501.3; 501.6.
For t = 501, the beam deflection w(x = 0.5, t = 501) is located in its counterpart
maximum. For t = 501.3, w(x = 0.5, t = 501.3) deflection is around zero, whereas
for t = 501.6, it is situated in the beam local minimum. For t = 501, one can observe
five local maxima and four minima on the snapshots of the beam 1. For t = 501.3,
(the beam deflection is around zero) the number of maxima and minima for n = 40
is fixed, whereas an increase in n = 80; 120; 160 implies a decrease down to four
and five, respectively. An increase in n = 120; 160 causes a dome-like shape of
the snapshot, i.e. the maximum is achieved only for x = 0.5. The deflection snapshots of the first and second beams coincide for n = 120; 160. Snapshots of beams
configurations for t = 501.3 and for n = 40; 80; 120; 160 are reported in Table 4.3.
In Table 4.4, the frequency power spectra, the 2D and 3D phase portraits, the
wavelet spectra for ω p ∈ [0.5; 5.1] and ω p ∈ [0.5; 2], and the Poincaré pseudo-maps
are reported for different numbers of the beam spatial coordinates.
In Tables 4.4 and 4.7, the number 1 corresponds to the number of spatial coordinate
partition, while 2 corresponds to the beam number.
We illustrate and discuss the dynamics of beams for n = 40; 80; 120; 160. For n =
40, linearly dependent frequencies
ω p
2
,
2ω p
5
,
3ω p
5
,
23ω p
30
as well as a chaotic component
are detected in the beam spectrum. The frequency spectra for the first and the second
beams have the same frequencies. The 2D and 3D phase portraits exhibit a “thick
ring” for the first beam, whereas “washed out cloud” is observed for the second
beam. The wavelet spectrum ω ∈ [0.2; 5.1] exhibits two frequencies ω p and
ω p
2
,
whereas the wavelet spectrum associated with ω ∈ [0.2; 2] exhibits three different
frequencies
ω p
15
,
4ω p
15
,
ω p
3
. The Poincaré pseudo-map presents a limit cycle for the first
103
Table 4.3 Snapshots of the beam shape (for w i,n (x), x ∈ [0; 1]), computed for different n =
40; 80; 100; 120; 140; 160 and t = 501.3 [reprinted with permission from International Journal of
Non-Linear Mechanics publishers]
can be observed in Table 4.2 that an increase in the number of beam partitions for
x ∈ [0; 1] implies an increase in the convergence.
In what follows, we investigate snapshots presenting changes in the shape of beams
for x ∈ [0; 1], n = 40; 80; 120; 160 at the fixed time instants t = 501; 501.3; 501.6.
For t = 501, the beam deflection w(x = 0.5, t = 501) is located in its counterpart
maximum. For t = 501.3, w(x = 0.5, t = 501.3) deflection is around zero, whereas
for t = 501.6, it is situated in the beam local minimum. For t = 501, one can observe
five local maxima and four minima on the snapshots of the beam 1. For t = 501.3,
(the beam deflection is around zero) the number of maxima and minima for n = 40
is fixed, whereas an increase in n = 80; 120; 160 implies a decrease down to four
and five, respectively. An increase in n = 120; 160 causes a dome-like shape of
the snapshot, i.e. the maximum is achieved only for x = 0.5. The deflection snapshots of the first and second beams coincide for n = 120; 160. Snapshots of beams
configurations for t = 501.3 and for n = 40; 80; 120; 160 are reported in Table 4.3.
In Table 4.4, the frequency power spectra, the 2D and 3D phase portraits, the
wavelet spectra for ω p ∈ [0.5; 5.1] and ω p ∈ [0.5; 2], and the Poincaré pseudo-maps
are reported for different numbers of the beam spatial coordinates.
In Tables 4.4 and 4.7, the number 1 corresponds to the number of spatial coordinate
partition, while 2 corresponds to the beam number.
We illustrate and discuss the dynamics of beams for n = 40; 80; 120; 160. For n =
40, linearly dependent frequencies
ω p
2
,
2ω p
5
,
3ω p
5
,
23ω p
30
as well as a chaotic component
are detected in the beam spectrum. The frequency spectra for the first and the second
beams have the same frequencies. The 2D and 3D phase portraits exhibit a “thick
ring” for the first beam, whereas “washed out cloud” is observed for the second
beam. The wavelet spectrum ω ∈ [0.2; 5.1] exhibits two frequencies ω p and
ω p
2
,
whereas the wavelet spectrum associated with ω ∈ [0.2; 2] exhibits three different
frequencies
ω p
15
,
4ω p
15
,
ω p
3
. The Poincaré pseudo-map presents a limit cycle for the first