

Processibility Analysis of Rotationally Moldable Linear …
41
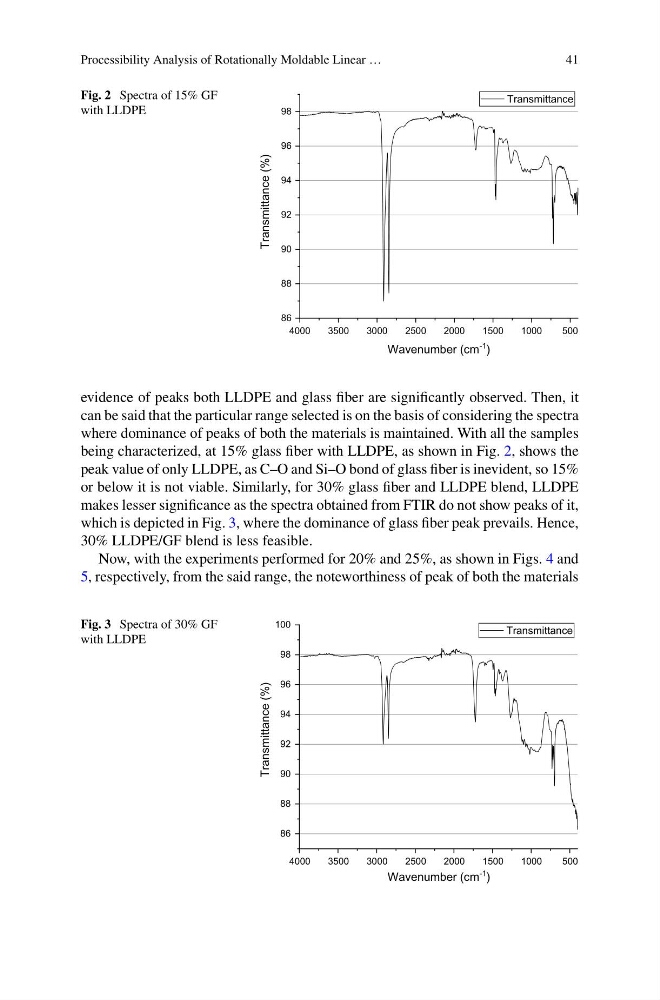
Fig. 2 Spectra of 15% GF
with LLDPE
4000
3500
3000
2500
2000
1500
1000
500
86
88
90
92
94
96
98
Transmittance (%)
Wavenumber (cm
-1 )
Transmittance
evidence of peaks both LLDPE and glass fiber are significantly observed. Then, it
can be said that the particular range selected is on the basis of considering the spectra
where dominance of peaks of both the materials is maintained. With all the samples
being characterized, at 15% glass fiber with LLDPE, as shown in Fig. 2, shows the
peak value of only LLDPE, as C–O and Si–O bond of glass fiber is inevident, so 15%
or below it is not viable. Similarly, for 30% glass fiber and LLDPE blend, LLDPE
makes lesser significance as the spectra obtained from FTIR do not show peaks of it,
which is depicted in Fig. 3, where the dominance of glass fiber peak prevails. Hence,
30% LLDPE/GF blend is less feasible.
Now, with the experiments performed for 20% and 25%, as shown in Figs. 4 and
5, respectively, from the said range, the noteworthiness of peak of both the materials
Fig. 3 Spectra of 30% GF
with LLDPE
4000
3500
3000
2500
2000
1500
1000
500
86
88
90
92
94
96
98
100
Transmittance (%)
Wavenumber (cm
-1 )
Transmittance
41
Fig. 2 Spectra of 15% GF
with LLDPE
4000
3500
3000
2500
2000
1500
1000
500
86
88
90
92
94
96
98
Transmittance (%)
Wavenumber (cm
-1 )
Transmittance
evidence of peaks both LLDPE and glass fiber are significantly observed. Then, it
can be said that the particular range selected is on the basis of considering the spectra
where dominance of peaks of both the materials is maintained. With all the samples
being characterized, at 15% glass fiber with LLDPE, as shown in Fig. 2, shows the
peak value of only LLDPE, as C–O and Si–O bond of glass fiber is inevident, so 15%
or below it is not viable. Similarly, for 30% glass fiber and LLDPE blend, LLDPE
makes lesser significance as the spectra obtained from FTIR do not show peaks of it,
which is depicted in Fig. 3, where the dominance of glass fiber peak prevails. Hence,
30% LLDPE/GF blend is less feasible.
Now, with the experiments performed for 20% and 25%, as shown in Figs. 4 and
5, respectively, from the said range, the noteworthiness of peak of both the materials
Fig. 3 Spectra of 30% GF
with LLDPE
4000
3500
3000
2500
2000
1500
1000
500
86
88
90
92
94
96
98
100
Transmittance (%)
Wavenumber (cm
-1 )
Transmittance