

40
N. Gupta and PL. Ramkumar
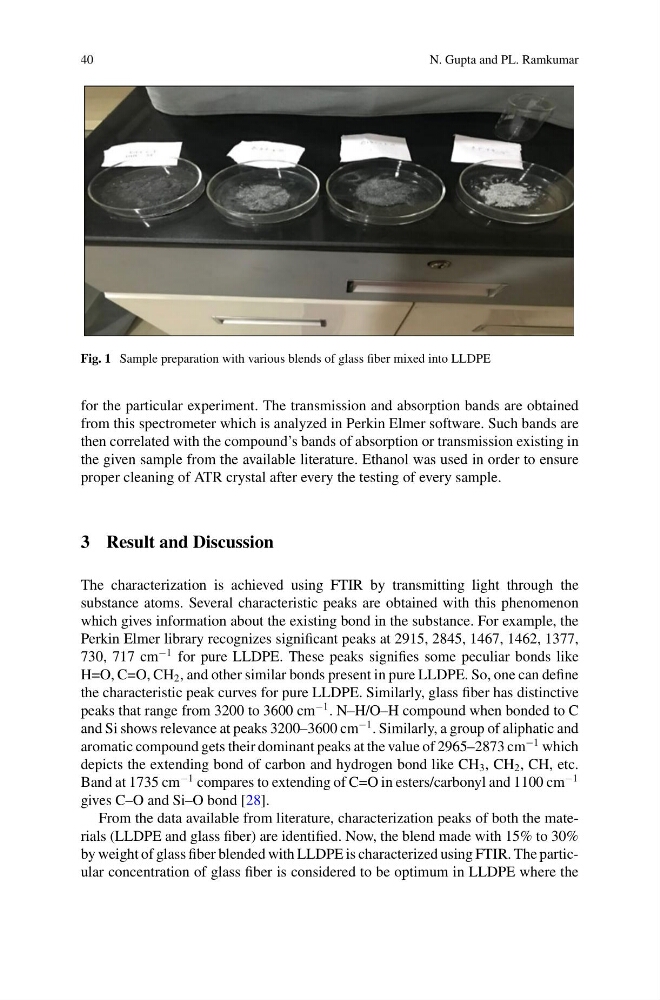
Fig. 1 Sample preparation with various blends of glass fiber mixed into LLDPE
for the particular experiment. The transmission and absorption bands are obtained
from this spectrometer which is analyzed in Perkin Elmer software. Such bands are
then correlated with the compound’s bands of absorption or transmission existing in
the given sample from the available literature. Ethanol was used in order to ensure
proper cleaning of ATR crystal after every the testing of every sample.
3 Result and Discussion
The characterization is achieved using FTIR by transmitting light through the
substance atoms. Several characteristic peaks are obtained with this phenomenon
which gives information about the existing bond in the substance. For example, the
Perkin Elmer library recognizes significant peaks at 2915, 2845, 1467, 1462, 1377,
730, 717 cm
−1 for pure LLDPE. These peaks signifies some peculiar bonds like
H=O, C=O, CH 2 , and other similar bonds present in pure LLDPE. So, one can define
the characteristic peak curves for pure LLDPE. Similarly, glass fiber has distinctive
peaks that range from 3200 to 3600 cm
−1 . N–H/O–H compound when bonded to C
and Si shows relevance at peaks 3200–3600 cm
−1 . Similarly, a group of aliphatic and
aromatic compound gets their dominant peaks at the value of 2965–2873 cm
−1 which
depicts the extending bond of carbon and hydrogen bond like CH 3 , CH 2 , CH, etc.
Band at 1735 cm
−1 compares to extending of C=O in esters/carbonyl and 1100 cm
−1
gives C–O and Si–O bond [28].
From the data available from literature, characterization peaks of both the materials (LLDPE and glass fiber) are identified. Now, the blend made with 15% to 30%
by weight of glass fiber blended with LLDPE is characterized using FTIR. The particular concentration of glass fiber is considered to be optimum in LLDPE where the
N. Gupta and PL. Ramkumar
Fig. 1 Sample preparation with various blends of glass fiber mixed into LLDPE
for the particular experiment. The transmission and absorption bands are obtained
from this spectrometer which is analyzed in Perkin Elmer software. Such bands are
then correlated with the compound’s bands of absorption or transmission existing in
the given sample from the available literature. Ethanol was used in order to ensure
proper cleaning of ATR crystal after every the testing of every sample.
3 Result and Discussion
The characterization is achieved using FTIR by transmitting light through the
substance atoms. Several characteristic peaks are obtained with this phenomenon
which gives information about the existing bond in the substance. For example, the
Perkin Elmer library recognizes significant peaks at 2915, 2845, 1467, 1462, 1377,
730, 717 cm
−1 for pure LLDPE. These peaks signifies some peculiar bonds like
H=O, C=O, CH 2 , and other similar bonds present in pure LLDPE. So, one can define
the characteristic peak curves for pure LLDPE. Similarly, glass fiber has distinctive
peaks that range from 3200 to 3600 cm
−1 . N–H/O–H compound when bonded to C
and Si shows relevance at peaks 3200–3600 cm
−1 . Similarly, a group of aliphatic and
aromatic compound gets their dominant peaks at the value of 2965–2873 cm
−1 which
depicts the extending bond of carbon and hydrogen bond like CH 3 , CH 2 , CH, etc.
Band at 1735 cm
−1 compares to extending of C=O in esters/carbonyl and 1100 cm
−1
gives C–O and Si–O bond [28].
From the data available from literature, characterization peaks of both the materials (LLDPE and glass fiber) are identified. Now, the blend made with 15% to 30%
by weight of glass fiber blended with LLDPE is characterized using FTIR. The particular concentration of glass fiber is considered to be optimum in LLDPE where the